Topology
You can view the topology from the servers that host the application, to the shared networks that connect it, to the storage that holds its data. This ability to put all the infrastructure in the context of the applications it serves, while understanding the application’s business value and the workload it generates against the infrastructure, is what makes IO app-centric in its approach.
IO uses the app-centric topology extensively across the platform, for defining dashboard contents, application or infrastructure topology views, and alarm policies. Topology is also used with the analytic infrastructure advisors for diagnosis and optimization.
Note
Topologies saved in a IO version prior to 6.0 are incompatible with this release. During installation of the current version IO, any existing saved topologies are archived and are no longer accessible from the Select a Saved Topology menu.
What Is Topology?
Topology is a graphical view of the interconnections and activity in your infrastructure.
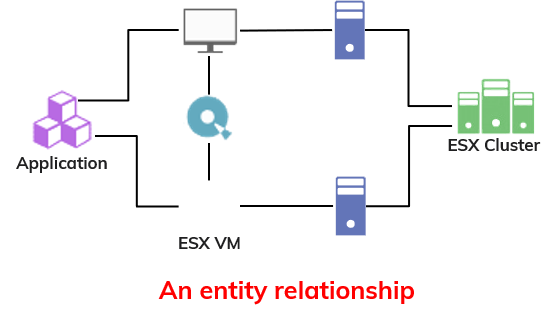
Topology shows you the entity relationships in the context of tiers and applications. The end-to-end infrastructure supporting the application is visible in a single view. Topology also shows you the status of each entity.

IO topology enables you to:
Identify if and how two or more entities interact with each other
Identify overlap for dependencies of two or more entities
Understand the end-to-end scope and scale of an application
Identify and understand potential problems in an entity’s data path
Understand where various entities live in the data center
Understand the impact of and impact to applications in your environment
Entity Representations in Topology
Topology supports multiple infrastructure views to cover major technology areas (compute, network, and storage). Multiple views provide different perspectives into the end-to-end infrastructure supporting your applications.
More than two dozen icons are used to represent different entity types. Colors vary based upon alarm conditions and node selections.
See the individual user guide for each integration that you install for an equivalent list of entity icons for the integration.
Entity Type | Icon | |
|---|---|---|
app |
| |
cache |
| |
conversation |
| |
cpu |
| |
disk |
| |
fabric |
| |
fabric card |
| |
fabric port |
| |
grouped cache |
| |
grouped cpu |
| |
grouped disk |
| |
grouped fabric-card |
| |
grouped fabric-port |
| |
grouped fabric |
| |
grouped host |
| |
grouped host card |
| |
grouped host port |
| |
grouped storage |
| |
grouped storage card |
| |
grouped storage port |
| |
grouped VM |
| |
host |
| |
host card |
| |
host port |
| |
Netapp |
| |
storage |
| |
storage card |
| |
storage port |
| |
tier |
| |
VM |
|










Topology Landing Page
Navigate to Topology by selecting the topology icon in the left-hand navigation panel. You can also navigate to Topology directly from other IO modules, such as Dashboards, Inventory, and Alarms and Cases.
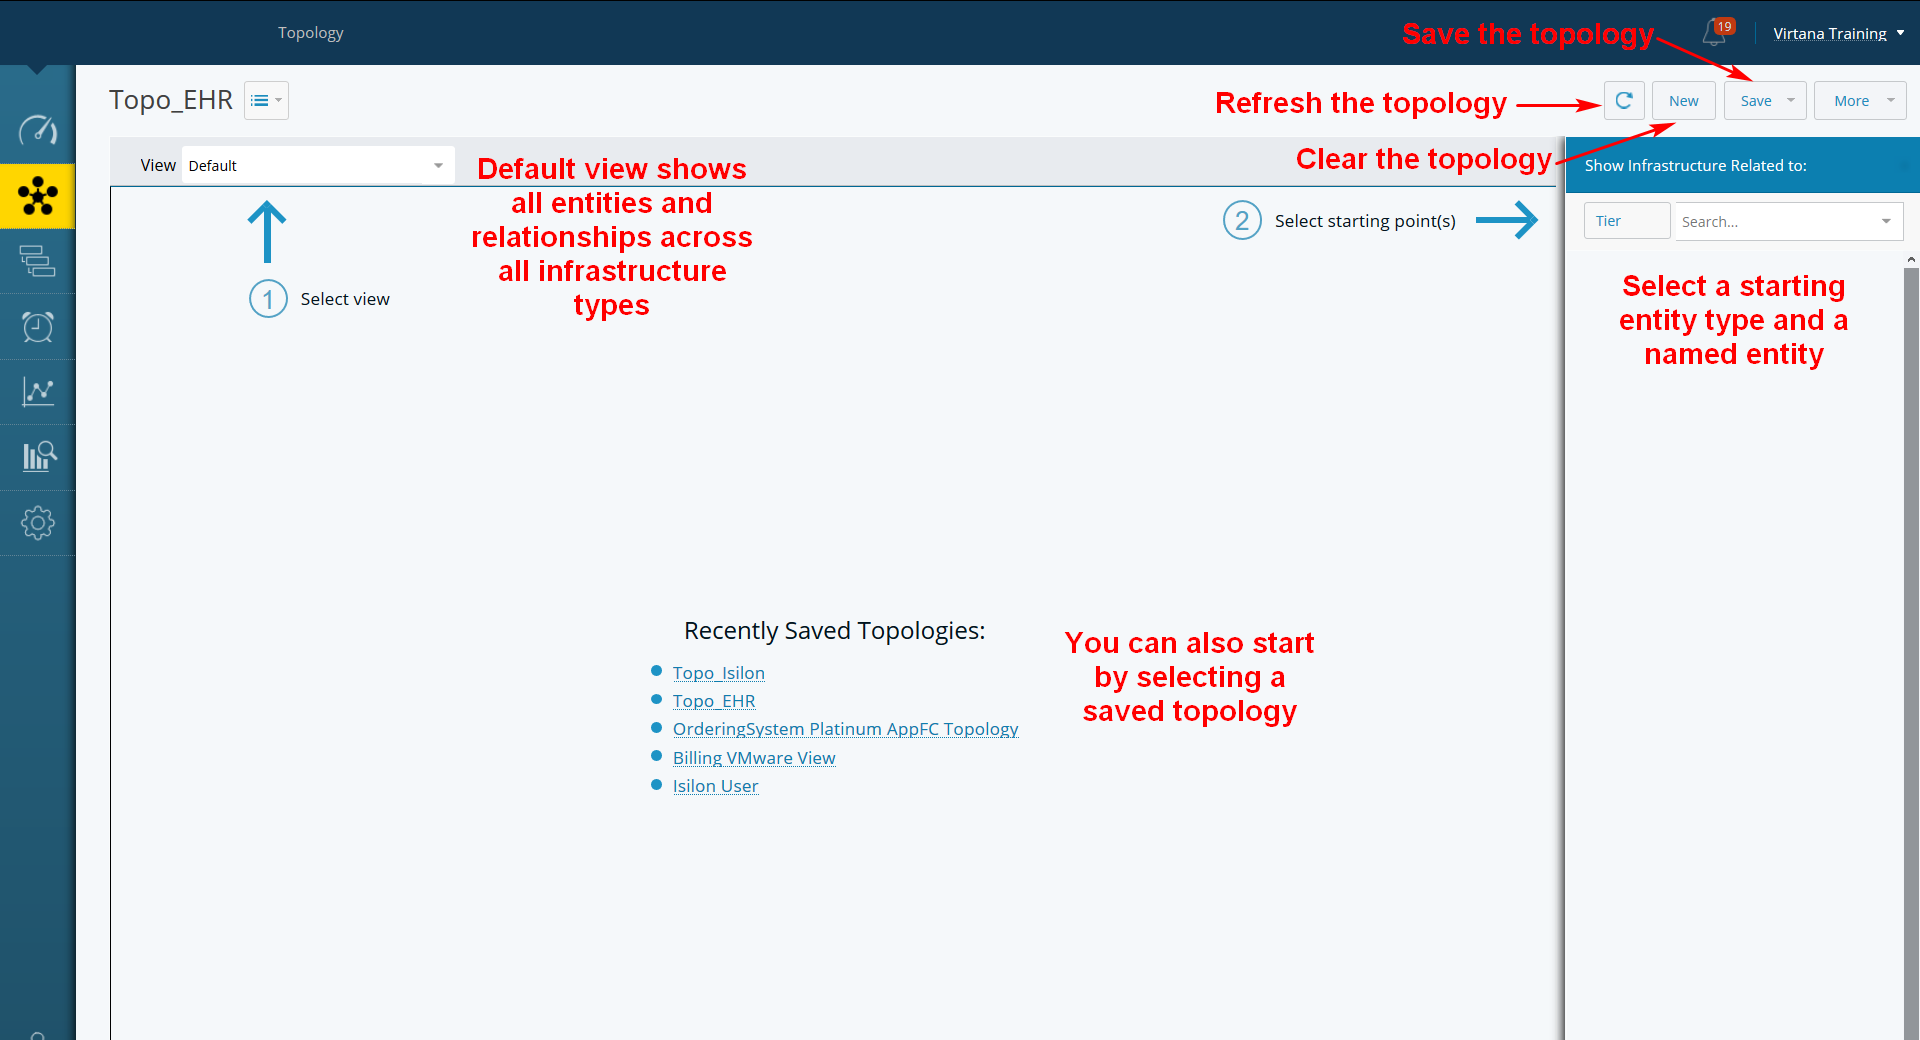
You must select a starting point for the topology. This is done by selecting an entity type and a named entity. You can also start by selecting a saved topology, if one is available.
The default view shows you all of the related entities across all integrations.
The “Show Infrastructure Related to” pane focuses the topology on a specified entity type, showing only entities related to that entity type.
There are two buttons at the top to clear the topology view and start over and to save the topology view so it can be used in the future.
You can refresh the data displayed in the topology by clicking the half circle icon.