 Event List + Count tile
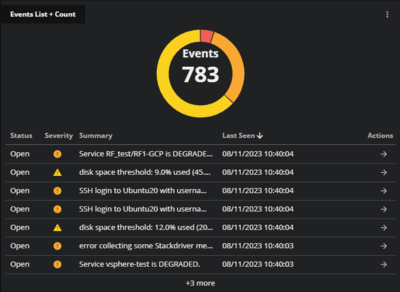
On the Event List + Count tile, you can view key information about events reported against entities in the dashboard’s scope during the current time range. You can configure this information to display in a donut chart, a table, or both. For example, you can view severity levels of events in a donut chart.
The donut chart shows the total event count and the groups that comprise that count. You can group events by a selected indicator, such as the severity level of events reported against entities in the dashboard’s scope during the current time range.
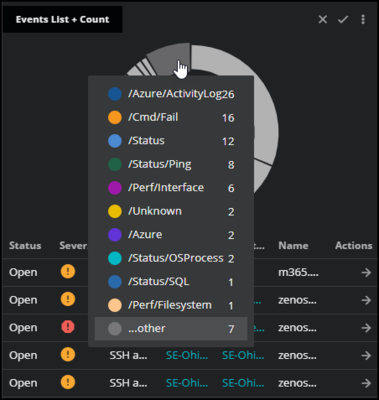
Hover your mouse over the sections in the donut chart to see the represented groups. If you select an indicator that has many groups, such as Entity or Event class, you can view the top ten entities or classes in the donut chart. The remaining items are collapsed into a single group that is color-coded as gray.
The table lists the events in the order you specify when configuring the tile. You can also select the arrow in the Actions column to navigate to the Events console to view the associated event in more detail.
Example tile
Configuring the tile
You can set the following options to determine how your tile appears in the dashboard.
Tile title
Enter the text that you want to use as the title of this tile. The title appears in the upper-left corner of the tile.
Group counts by
Select the criteria to use for grouping event counts in the donut chart. For example, select Severity to group the events by severity levels such as Warning, Critical, and Error. Hover your mouse over the sections in the donut chart to see the represented groups.
If you select an indicator that has many groups, such as Entity or Event class, you can view the top ten entities or classes in the donut chart. The remaining groups are collapsed together as …other and are color-coded as gray.
Show
Select the view for the tile. You can select Donut, Table, or both. By default, both views are selected.
Adjust columns
Select the event fields to include as columns in the table. For example, you may want to select Status, Severity, and Last seen as columns in the table.
Sort list by
Select the column that determines the order of the items in the table. For example, you can select to sort by Severity.
Rows to display
Select the number of rows to include in the table. If the tile is too small, the number of rows is truncated. You can resize the tile to show more rows.
Filters
Configure one or more comparisons that select events to include in a tile. Events that don’t match all comparisons are excluded.
You can specify the following fields in comparisons. If you specify the same field multiple times, the field values are combined.