What is Virtana AIFO?
Virtana AI Factory Observability (AIFO) is a full-stack observability solution built to monitor your AI applications and every layer that supports them. Unlike traditional monitoring tools, Virtana AIFO answers questions about why AI systems behave as they do, not just whether they are running.
This guide introduces the three layers that make up Virtana AIFO and shows you how to deploy each one. If you’re new to Virtana AIFO, start with this chapter to understand what each layer covers, then go to the chapter for the layer you want to deploy.
You can use Virtana AIFO across one or more layers depending on your needs. Each layer can be observed independently or together as a complete stack. The more data sources you connect, the more comprehensive your observability coverage becomes.
Caution
For the most complete and accurate analysis, deploy the full Virtana stack. Connecting the full stack breaks down the data silos that limit traditional observability tools and gives you the most comprehensive observability coverage.
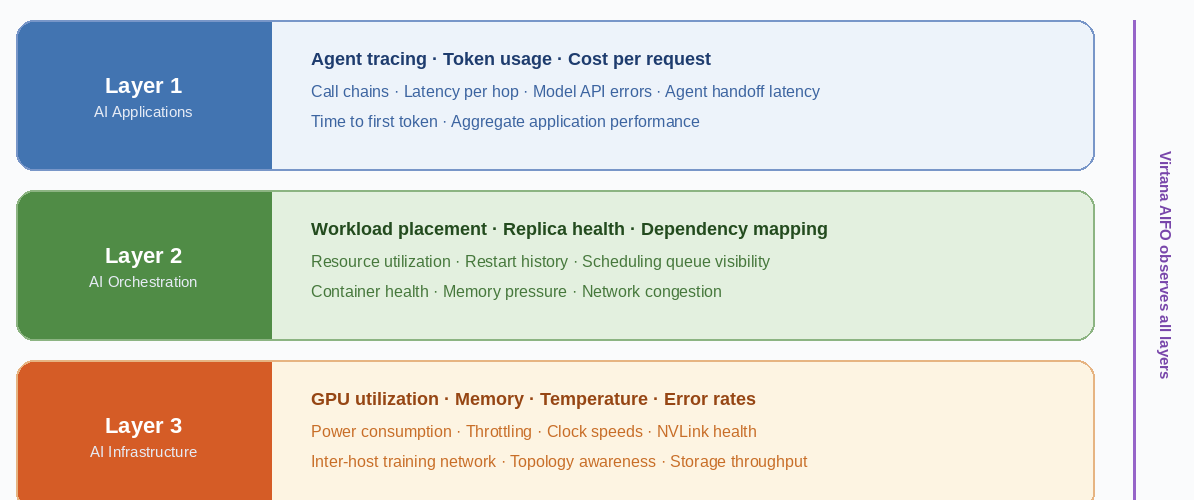
Virtana AIFO observes three independent layers: AI applications (Layer 1), orchestration (Layer 2), and infrastructure (Layer 3). Each layer can be deployed independently.
AI observability layers
AI observability spans three layers, from the application down to the underlying infrastructure. The following table summarizes what each layer covers, the key questions it helps you answer, and the Virtana module that captures the data for that layer.
Layer | What it covers | Key questions it helps you answer | Virtana module |
|---|---|---|---|
Layer 1: AI applications | Traditional application signals, such as latency, errors, and response time Agentic signals for applications that use AI agents, including call chains, token usage, model API behavior, and cost per request | Why is this response slow? Which agent failed? What did this request cost? | Application Observability and Service Observability |
Layer 2: AI orchestration | Container health Workload placement Replica status Scheduling queues | Is the container restarting? Is the host under memory pressure? Is the job queued? | Container Observability |
Layer 3: AI infrastructure | GPU health and performance Network interconnects Storage throughput | Am I using my GPUs efficiently? Are they throttled? Is my NVLink network configured correctly? Is network or storage congestion limiting training throughput? | Infrastructure Observability |
Note
You don't need to deploy all three layers at once. Adoption is incremental by design. Start with the layer that addresses your most pressing observability gap, and add others as your needs grow.
About the modules
Each module in the previous table is documented separately. Use the following links to learn more about setup, configuration, and use cases for each module.
Application Observability and Service Observability: Application Observability captures traditional and agentic application signals, such as latency, errors, and agent call chains. Service Observability connects these application signals with infrastructure components into a single operational view. Learn more: Application Observability documentation and Service Observability overview.
Container Observability: Provides deep, real-time visibility into containerized environments, supporting monitoring and proactive issue resolution for applications that run on microservices architectures. Learn more: Container Observability documentation.
Infrastructure Observability: Gives deep visibility into infrastructure health and performance, helping you monitor hybrid environments, understand service dependencies, and quickly identify and resolve performance issues. Learn more: Infrastructure Observability documentation.
Layer 1: AI applications
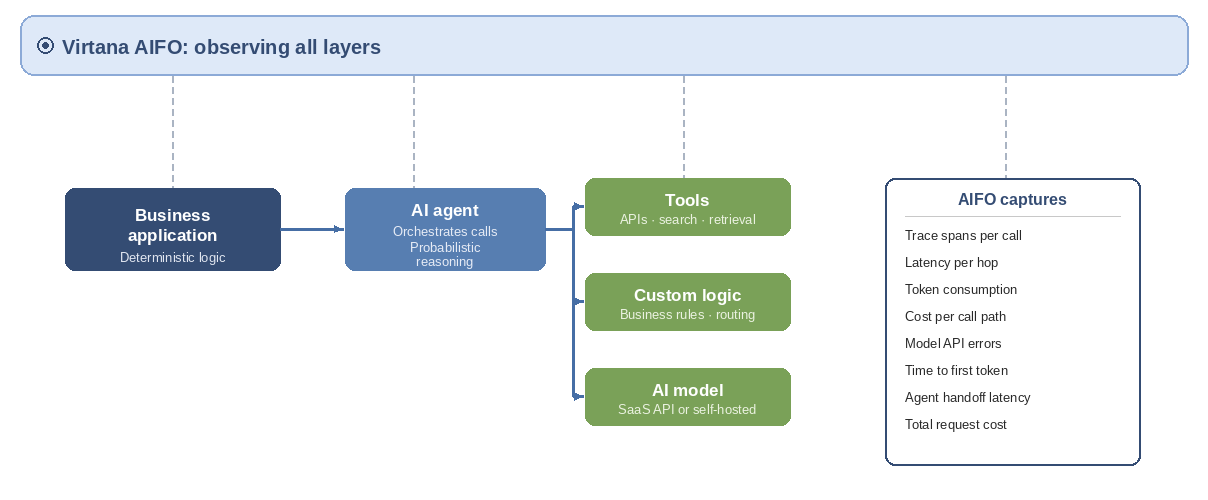
Layer 1 (AI applications) provides visibility into the behavior of AI applications and the AI agents they use to handle requests. This layer captures what happens inside your AI application: which agents were called, in what order, how long each took, and what each call cost.
Layer 1 covers both inferencing and training workloads at the application level. For infrastructure-level visibility, see Layer 3: AI infrastructure.
What Virtana AIFO monitors at Layer 1
At the application layer, Virtana AIFO captures traditional signals such as latency, response time, and errors, as well as agentic signals such as token consumption, cost, and time to first token. The following table lists some of the key signals Virtana AIFO observes.
Signal | Description | Why it matters |
|---|---|---|
Trace spans per call | A record of every agent call made during a request, in order | Reveals the full call chain so you can identify exactly where time was spent |
Latency per hop | Time taken by each individual agent call | Pinpoints slow agents within a multi-agent chain |
Token consumption | Tokens sent and received at each model API call | Identifies agents sending oversized prompts that increase cost and parse time |
Cost per call path | Total token cost across a request | Enables cost attribution per request, user, or workflow |
Model API errors | Error rates returned by model API calls | Surfaces reliability issues with specific models or endpoints |
Time to first token | Delay between a model API call and the first token in the response | Indicates model-side latency separate from network or agent overhead |
Agent handoff latency | Time spent passing context between agents in a chain | Identifies bottlenecks at agent boundaries, not inside agents |
Total request cost | End-to-end cost for a complete user-facing request | Enables financial tracking and anomaly detection at the request level |
Inferencing application monitoring
An inferencing application is any system that uses a trained AI model to produce an output in response to an input. Inferencing is the most common form of AI adoption: a business application delegates tasks to AI agents, which call models hosted externally as SaaS APIs or run internally on cloud or on-premises GPU infrastructure.
Inferencing requests tend to be short and frequent. A single user action can trigger dozens of agent calls within seconds. Virtana AIFO captures each call as a trace span and correlates them into a complete picture: which agents were called, in what order, how long each took, and what it cost.
Training application monitoring
A training application builds a specialized AI model by processing large volumes of data through an iterative, compute-intensive learning process. Virtana AIFO monitors training applications at Layer 1 to give you visibility into job execution and progress.
Virtana AIFO gives you visibility into the following areas for training applications:
What jobs are running and how long they are taking: Track the progress and duration of training runs in real time.
Whether jobs are completing successfully or failing: Detect failures early and understand the point at which a job stopped progressing.
Note
Layer 1 training monitoring covers job state and progress. For GPU utilization, NVIDIA NVLink health, and storage throughput during training, see Layer 3: AI infrastructure.
Layer 2: AI orchestration
Layer 2 (AI orchestration) provides visibility into where AI workloads are deployed and whether the container and scheduling infrastructure supporting them is healthy. At this layer, Virtana AIFO surfaces the same class of problems that platform teams encounter in traditional environments, in the context of the AI agents and training jobs that depend on them.
When a slowdown or failure is identified at Layer 1 (AI applications), Layer 2 helps you determine the root cause: is the issue in your application code, your orchestration and deployment configuration, or your underlying infrastructure? For hardware-level analysis, see Layer 3: AI infrastructure.
What Virtana AIFO monitors at Layer 2
The following table lists some of the key signals available at Layer 2 for both inferencing agents and training jobs.
Signal | What Virtana AIFO shows | Common use case |
|---|---|---|
Workload placement | Which host, cluster, and availability zone each workload is running on | Confirm that a slow agent is not on an overloaded host |
Replica count and health | How many replicas of each workload are running and whether they are healthy | Identify whether autoscaling has responded correctly to load |
Dependency health | Status of services, volumes, config maps, and secrets each workload depends on | Find misconfigured dependencies causing intermittent failures |
Resource utilization | CPU, memory, and network consumption at the container and host level | Correlate resource pressure with application latency from Layer 1 |
Restart history | Restart count, failure reason, and timing for each container | Distinguish transient faults from systemic instability |
Scheduling queue | Pending state, queue depth, and blocking conditions for training jobs | Identify delays that occur before a job starts running |
Traditional infrastructure problems still apply to AI workloads
AI workloads run on the same container and scheduling infrastructure as traditional workloads. The following are common Layer 2 conditions that affect AI workload performance.
Container restarts. An AI agent that appears slow may be restarting frequently due to an out-of-memory (OOM) condition or a liveness probe misconfiguration. Virtana AIFO surfaces restart counts and reasons alongside agent call chain data from Layer 1.
Host memory pressure. A host running near its memory limit may cause containers to be throttled or evicted. GPU workloads are particularly sensitive to host memory pressure if they use host-side memory for data staging.
Scheduling delays. Training jobs often wait in a scheduling queue before they can run. A job that appears to be failing may in fact be queued. Virtana AIFO surfaces queue depth and pending state separately from execution state.
Network congestion. Container-to-container and container-to-storage network congestion can increase agent call latency and reduce training data throughput. This is visible at Layer 2 before it becomes visible at Layer 1 or Layer 3.
Note
Layer 2 signals are available for workloads running on Kubernetes. For workloads running on bare-metal hosts or other orchestrators, contact your Virtana account team for supported configurations.
Layer 3: AI infrastructure
Layer 3 (AI infrastructure) provides visibility into the physical and virtual hardware on which AI workloads run. This is where GPU efficiency, storage throughput, and network performance are monitored, and where some of the most impactful and least visible performance bottlenecks are found.
Layer 3 can be deployed independently of Layers 1 and 2. If your priority is hardware observability, such as monitoring GPU health for a training cluster, you can use Layer 3 without agent instrumentation. When all three layers are deployed, Layer 3 signals are correlated with application and orchestration signals from Layers 1 and 2.
Note
Layer 3 covers both inferencing and training workloads. The signals described in this section apply to any AI workload that runs on GPU infrastructure.
GPU health monitoring
Virtana AIFO monitors GPU health continuously for every device in your environment. The following signals are collected for all GPU workloads, regardless of workload type.
Hardware errors
Because elevated error rates are early indicators of device degradation, Virtana AIFO tracks the following GPU hardware error types per device:
Error-correction code (ECC) memory errors: Both correctable and uncorrectable
Xid errors: NVIDIA driver-level error events that indicate GPU faults
NVLink errors: Communication faults between GPUs within a host
Warning
A GPU with uncorrectable ECC errors should be removed from service immediately. Training jobs running on a degraded GPU may produce incorrect model weights without surfacing an explicit job failure.
Throttling state
GPU throttling occurs when a device reduces its clock speed in response to a constraint. Virtana AIFO identifies the throttling state for each device and the reason, including thermal throttling, power throttling, and clock management throttling.
Identifying the reason is essential: a thermally throttled GPU requires a cooling or placement fix, while a power-throttled GPU may require a power delivery upgrade or workload redistribution.
Temperature
When a GPU exceeds its thermal threshold, the device throttles its clock speeds to prevent damage. This throttling reduces throughput and increases latency, often without producing an explicit error or alert in standard monitoring tools.
Virtana AIFO monitors temperature per device and flags devices that are approaching throttle thresholds. This lets you identify thermal issues, such as inadequate cooling, blocked airflow, or high-density rack configurations, before they cause a measurable performance impact.
Warning
A GPU that is thermally throttling may appear healthy in standard CPU and memory metrics. Temperature and throttling state monitoring in Virtana AIFO Layer 3 is required to detect this condition.
Memory usage
GPU memory (VRAM) is a finite resource that AI workloads consume at scale. Virtana AIFO tracks memory consumption per device and per workload. Memory pressure, where a workload approaches or exceeds available VRAM, causes job eviction, out-of-memory errors, and forced model offloading. Virtana AIFO surfaces memory pressure before it causes failures, giving you time to resize workloads or redistribute load across devices.
Utilization
GPU utilization measures how much of each device’s compute capacity is actively being used. Virtana AIFO tracks utilization per device, per workload, and over configurable time windows.
Low utilization on a training job indicates that the GPU is not being supplied with enough work, which is a common symptom of a storage or data pipeline bottleneck. High utilization on an inferencing workload may indicate that the device is saturating and that latency will increase under continued load.
Tip
Correlate GPU utilization with Layer 1 agent latency data to distinguish between model-side slowness (a GPU signal) and agent-side slowness (an application signal). This correlation requires both Layer 1 and Layer 3 to be deployed.
Clock speeds
Streaming multiprocessor (SM) and memory clock speeds determine GPU compute throughput. Virtana AIFO monitors clock speeds per device and flags clock degradation, where clocks drop below expected frequencies under load without an explicit throttle event. Clock degradation under load is a sign of hardware stress, driver misconfiguration, or an underpowered device.
GPU selection and workload fit
Virtana AIFO helps you verify that the right GPU type is assigned to each workload. Inferencing and training workloads have different GPU requirements, and using the wrong type introduces inefficiency that is immediately visible when GPU utilization is correlated with job performance.
Workload type | Typical characteristics | GPU priority |
|---|---|---|
Inferencing | Short duration, high frequency, low batch size | Low latency, predictable throughput, fast memory bandwidth |
Training | Long duration, high throughput, large batch size | Sustained compute utilization, efficient data supply, high memory capacity |
When GPU utilization is low on a training job, the GPU is not the bottleneck. Investigate storage throughput or data pipeline configuration. When utilization is consistently high on an inferencing deployment, the cluster may be undersized for the request volume.
GPU interconnect monitoring
For multi-GPU and multi-node training jobs, the connections between GPUs are as important as the GPUs themselves. Virtana AIFO monitors both intra-host and inter-host GPU connectivity.
NVLink: Intra-host GPU connectivity
NVLink is the high-speed interconnect used to connect multiple GPUs within a single host. During distributed training, GPUs use NVLink to synchronize gradients across devices. A degraded or failed NVLink connection creates a bottleneck in gradient synchronization that slows the entire training job.
Virtana AIFO monitors NVLink bandwidth utilization and error rates per link, and the state of each NVLink connection. Elevated error rates on a specific link identify the failing connection before it causes a job failure.
Note
NVLink monitoring requires the NVIDIA Management Library (NVML) to be accessible on the host. Virtana AIFO collects NVLink metrics through the AIFO Collector agent running on each GPU host.
Training network: Inter-host GPU connectivity
For multi-node training jobs, GPUs on different hosts communicate through a dedicated high-speed training network, typically InfiniBand or RDMA over Converged Ethernet (RoCE). Network congestion or degraded links on the training network directly reduce gradient synchronization throughput and slow training.
Virtana AIFO monitors inter-host network throughput, latency, and congestion events on the training network.
Warning
Training network issues are frequently invisible to application-level monitoring. A training job that is progressing slowly may appear healthy at the GPU and CPU level while the training network is the actual bottleneck. Layer 3 training network monitoring is required to detect this condition.
Training topology awareness
Virtana AIFO surfaces the topology of your training job: which GPUs are communicating with which other GPUs, and through which path (NVLink within a host, or training network across hosts). This information is used to verify that your job placement matches your hardware topology. A gradient synchronization step that crosses a slow inter-host link takes significantly longer than one that stays within a host on NVLink.
Storage throughput monitoring
Training workloads require a continuous supply of data to keep GPUs busy. If storage cannot deliver data fast enough, GPUs idle between batches, a condition known as I/O-bound training. Virtana AIFO monitors storage read throughput, referred to as DSK (disk) signals, and correlates it with GPU utilization. When GPU utilization drops in a regular pattern that aligns with storage read cycles, the training job is I/O-bound.
Tip
I/O-bound training is particularly common in on-premises deployments where training data is stored on spinning-disk NAS systems. If Virtana AIFO shows periodic GPU idle time correlated with storage reads, consider moving training data to local NVMe storage or a high-throughput parallel file system.
Infrastructure signals reference
The following table provides a complete reference for the infrastructure signals that Virtana AIFO monitors at Layer 3. The Workload column indicates whether a signal applies to model training, inferencing, or both.
Signal category | Signal | Description | Workload |
|---|---|---|---|
GPU compute | Utilization (%) | Percentage of GPU compute capacity in use | Both |
GPU compute | Memory usage (MB/GB) | GPU memory consumed by active workloads | Both |
GPU compute | Temperature (°C) | Device temperature. Throttle threshold varies by GPU model. | Both |
GPU compute | Power draw (W) | Current power consumption per device | Both |
GPU compute | Streaming multiprocessor (SM) clock speed (MHz) | Streaming multiprocessor clock frequency | Both |
GPU compute | Memory clock speed (MHz) | Memory interface clock frequency | Both |
GPU compute | Throttling state | Whether the device is throttled and the reason (thermal, power, or clock) | Both |
GPU errors | ECC errors: correctable | Single-bit memory errors corrected by ECC. High counts indicate degrading GPU memory. | Both |
GPU errors | ECC errors: uncorrectable | Double-bit memory errors not correctable by ECC. Indicates hardware failure. | Both |
GPU errors | Xid errors | NVIDIA driver-level error events. Specific Xid codes map to specific fault types. | Both |
Interconnect | NVLink bandwidth (GB/s) | Data transfer rate per NVLink connection between GPUs within a host | Training |
Interconnect | NVLink error rate | Communication errors per link. Elevated rates indicate a degraded connection. | Training |
Interconnect | Training network throughput (GB/s) | Inter-host data transfer rate across InfiniBand or RDMA over Converged Ethernet (RoCE) fabric | Training |
Interconnect | Training network latency (µs) | Round-trip time between GPU hosts on the training network | Training |
Storage | Read throughput (MB/s) | Storage read rate. Correlated with GPU utilization to detect I/O-bound training. | Training |
Host | CPU utilization (%) | Host CPU load. Relevant for data pre-processing and agent orchestration | Both |
Host | Available host memory | Available host RAM. Low availability can cause GPU-to-host memory spill. | Both |