2026 updates
Welcome to the 2026 update notes for Virtana Service Observability (formerly Zenoss Cloud). The visible and not-so-visible parts of Virtana Service Observability are updated regularly. This page highlights the new features and enhancements.
September
This month's updates include the following enhancements:
Actions > Rules > Delayed notifications
Action rules can now wait before sending a notification. The new Delay seconds field in the ADD RULE dialog box makes a rule pause after a trigger matches, then sends the notification only if the condition still applies when the delay ends. Use a delay to cut noise from conditions that resolve on their own, or to build an escalation path in which later groups are notified only when an issue stays unresolved. Existing rules are unaffected because the default delay is 0.
To learn more, see Add a rule and Rule resources.
Metric data search in the API
You can now retrieve time series metric data through the API. The new POST /v1/metrics:search resource returns the metric data collected for one entity over a time range that you specify, aggregated into fixed-length periods by the function of your choice. Use it to chart metric data in your own portal, or to pass raw metric data to another system, without opening Virtana Service Observability. Filter criteria select the entity, and optional criteria narrow the results to specific metrics on that entity.
To learn more, see Search for metric data.
Site Availability Monitor > SSL certificate monitoring
You can now monitor the expiration of SSL certificates for the sites in your Site Availability Monitor (SAM) configuration. Add a certificate_params section to a URL and set warning_threshold, critical_threshold, or both, as a number of days. When a certificate is due to expire within a threshold, Virtana Service Observability generates a warning or critical event, so you can renew the certificate before the site becomes unreachable. A certificate that has already expired generates a critical event.
certificate_params:
  warning_threshold: 5
  critical_threshold: 3
For more information, see Site Availability Monitor (SAM) connector.
Site Availabilty Monitor > Connector tags in models, metrics, and events
Tags that you assign to a SAM connector are now included in the metadata for the models, metrics, and events that the connector creates. You can view and filter by these tags in Inventory, SmartView, and the Events console. For more information, see Set up a Site Availability Monitor (SAM) connector
Site Availability Monitor > Fixed issues
The following Site Availability Monitor (SAM) issues are fixed in this update:
Down events for a subpage now close when the subpage comes back up. Previously, these events often stayed open until someone closed them manually.
A site with certificate parameters applied now shows its correct status in the SAM tile. Previously, a site that was up could appear with a status of Unknown.
The Events console now displays all tags for a connector that is configured with multiple tags. Previously, only the last tag appeared.
The SmartView small graph now displays all tags for a connector, formatted across multiple lines when needed. Previously, some tags were missing.
The Tags field now appears once in the SmartView small graph dialog box. Previously, the field appeared twice with the same values.
This month's updates include the following enhancements:
Actions > Destinations > Webhook URL templates
The URL field of a webhook destination now supports templates. Previously, the URL had to be a fixed value.
Use a template when the receiver expects a value that comes from the context of an action, such as a token that an on-call system reads from the query string:
https://oncall.example.com/incoming?token={{{event.alertToken}}}
Three template functions are also available for escaping a value that you use in a URL: lib.path_escape, lib.query_escape, and lib.quote. For more information, see Message templates.
Actions > Destinations > External availability
You can now send events to a destination directly from the Events console, without waiting for a trigger to fire. This is useful when you spot an event that needs attention in another system, such as opening a ticket in an incident management tool.
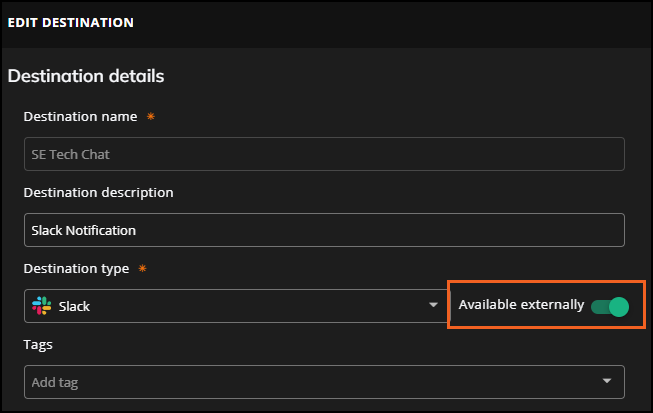
Destinations have a new Available externally option, next to Destination type. Users with the Manager role turn on this option when they add or edit a destination on the ADMIN > Actions page, on the DESTINATIONS tab.
In the Events console, select up to 10 events, click Send notification, and then choose a destination.
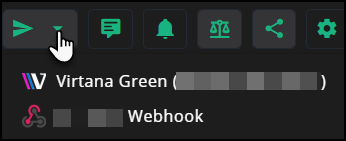
The list shows only the destinations that have Available externally turned on. Triggers and automated actions use destinations the same way as before, whether the option is on or off.
For more information, see Add a destination and Manage events.
You can now monitor your AWS infrastructure directly from Virtana Service Observability using the new AWS Cloud Monitoring connector. The connector collects Amazon CloudWatch metrics from a single AWS account or from multiple linked accounts, giving you immediate visibility into common AWS services and infrastructure health.
Why is this important to you?
Teams can now monitor their entire AWS environment, including multi-account organizational structures, directly in Virtana, with secure role-based access control and pre-built dashboard templates. There's no need to switch between AWS and Virtana to review key infrastructure metrics.
How does it work?
To add an AWS Cloud Monitoring connector, go to Admin > Connectors and click ADD CONNECTOR, then select the Amazon Web Services card. Configure authentication using one of two methods:
IAM Role: Provide an IAM Role ARN for secure, role-based access. Use the recommended CloudFormation script to create or validate the role and trust relationship directly from the connector dialog.
Access Key: Select or create an AWS credential in the Credential Store (clientKey, clientSecret, and accountId).
After saving a successful connection, you can create a dashboard from an AWS template for immediate visibility into your monitored services. To learn more, see AWS Cloud Monitoring connector.
A new Amazon Web Services credential type is now available in the Credential Store. Use this credential type when setting up an AWS Cloud Monitoring connector with Access Key authentication.
You no longer need to enter raw AWS access key values directly each time you configure a connector. Instead, store your AWS credentials once in the Credential Store and reuse them across connectors, improving security and simplifying management.
How does it work?
To add an AWS credential, go to Admin > Credentials, click ADD CREDENTIAL, and select Amazon Web Services from the Credential type list. Provide the following values:
clientKey: The access key ID for your AWS account.
clientSecret: The secret access key for your AWS account.
accountId: Your AWS account ID.
Once saved, the credential is available for selection when configuring Access Key authentication on the AWS Cloud Monitoring connector. To learn more, see AWS credentials.
You can now connect external AI-powered tools to Service Observability using the Model Context Protocol (MCP) Server. The MCP Server exposes your observability data, such as entities, events, metrics, and model information, to compatible MCP clients (for example, Goose, Claude, or other LLM-based tools), enabling natural-language queries against your environment.
Why is this important to you?
The MCP Server allows you to interact with your Service Observability data from your preferred AI assistant or developer tool, without being limited to the built-in Copilot. This means you can ask questions about your infrastructure health, troubleshoot issues, and retrieve operational insights directly from third-party clients, all using conversational language.
How does it work?
There are two ways to access the SO MCP Server:
Built-in Copilot: No additional configuration is needed. The Copilot in the Service Observability UI connects to the MCP Server automatically.
External MCP clients: To connect an external client, you need to generate an API key and construct the MCP endpoint URL.
To learn more, see Virtana Service Observability MCP Server.
You can now type the Start date and time directly when creating or editing a maintenance window, instead of selecting each value from the calendar and time picker. The calendar picker remains available for point-and-click entry.
Supported formats are:
MM/DD/YYYY, for example,08/13/2026.MM/DD/YYYY HH:mm, 24-hour format, for example,08/13/2026 14:30.
If you use hyphens between date components, they are converted to slashes. Seconds are not applied; for example, 12:25:45 becomes 12:25. If you enter only a date, the time defaults to the next valid time for that date. See, Create a maintenance window.
The following updates are available in Dashboards:
A new Device Status tile is now available in Dashboards. This tile provides an at-a-glance honeycomb visualization of device up/down status.
Each device is displayed as a color-coded hexagon: green for UP, red for DOWN.
A device is classified as DOWN if it has an open CRITICAL or ERROR event in the
/Status/Pingevent class; otherwise it is UP.The tile displays a count of down devices out of the total scoped devices (for example, 11 | 21 devices down).
Hovering over a hexagon displays the device name and its organizer path.
Supports a configurable tile title, subtitle, and tile scope filters.
Supports file export and fullscreen mode.
Handles up to 9,999 scoped devices per tile. A warning banner is displayed when the dataset exceeds that limit.
The Metric + Number tile now supports a Time aggregator option, giving users additional control over how the displayed number is calculated from the metric series.
The existing Aggregator field is renamed to Metric aggregator with the tooltip: Aggregation function used to combine multiple matching metrics into a single series.
A new Time aggregator field is added with the tooltip: Aggregation function used to summarize series into the single displayed number. The following values are available:
Last (default)
Mean
Maximum
Minimum
Standard deviation
Sum
The following update is available in Inventory:
You can now delete multiple maintenance windows in bulk from the Inventory page. Select one or more rows in any Inventory query, click the three-dot menu (⋮) in the toolbar, and select Delete. This eliminates the need to delete maintenance windows one at a time.
This month's updates include the following announcements:
The planned deprecation of the Collection Zone (CZ) Maintenance Window feature has been postponed. Existing CZ maintenance windows remain fully supported in production environments. An updated timeline for the final deprecation and the production rollout of the new cloud-based functionality will be provided in a future announcement.
Current status
You can continue to create and manage maintenance windows in the CZ environment.
Recommended actions
Take the following steps to prepare for the upcoming migration to the cloud:
Request early access. To be among the first to try the new maintenance windows, contact your customer success manager (CSM).
Audit your CZ maintenance windows. Review your current CZ environment and remove any obsolete or unwanted maintenance windows. Only active, recurring schedules should remain to ensure a clean data migration.For more information, contact Virtana Support.
This month's updates include the following enhancements:
When you check the Activity and Timeline tabs within Admin > Maintenance Windows, you may now see a maintenance window in a "Partially Completed" state. The "Partially Completed" state is represented with a lighter yellow color and a half-circle icon.
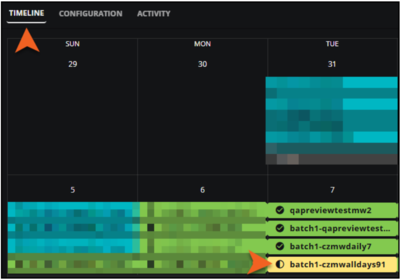
Why is this important to you?
This new state provides a visual indication of the true progress of your maintenance window. It means the instance has finished the standard "In Progress" phase, but can’t be fully verified as "Completed."
When you see "Partially Completed" as the status, it indicates that the system detected a potential issue that requires further investigation. This can happen if:
A potential silent failure was detected, for example, the change wasn't communicated correctly to Collection Zone (CZ).
Certain runtime errors occurred that might succeed upon retry.
The entities involved were part of multiple maintenance windows that started and ended simultaneously.
Important
Because the maintenance window is waiting on a successful rerun, it's critical that you do not manually change any states on the CZ side that might be overwritten by the automated rerun process. This status only applies to maintenance windows that include Collection Zone devices.
The maintenance window remains in the "Partially Completed" state, even after a rerun succeeds. The "Completed" state is only applied if no rerun was needed. This ensures you are always aware of instances that required additional system verification before reaching final success.
If you see a "Partially Completed" state for a maintenance window, go to CZ and check if the Production State is updated as expected. If you see "Partially Completed" maintenance windows on a regular basis, contact Virtana Support.
To learn more, see Maintenance window calendar.
We've updated the Maintenance Window Timeline with new Day and Week views, so you can easily switch between Day, Week, and Month views using the view selector. This enhancement helps administrators confidently manage complex maintenance workflows by providing a granular level of detail to review overlapping schedules and validate the timing and duration of maintenance windows.
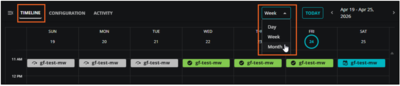
In addtion, you can see more details in your Timeline views. Days containing five or more maintenance windows now display an indicator showing the total count, for example, "2 more".
To see the change, click Admin > Maintenance Window, then select the Timeline view.
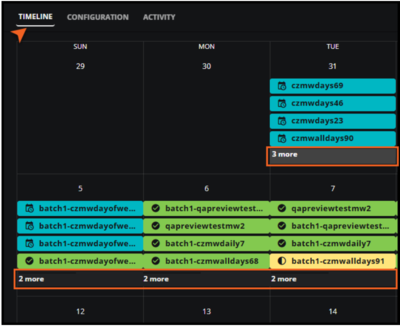
To learn more, see Maintenance window calendar.
The Inventory page now features an updated sidebar experience. When opened, the sidebar remains visible, pushing the main content to the right instead of overlapping it.
The sidebar contains two tabs: Queries and Organizers. Selecting a tab instantly loads the corresponding view in the main page. With the sidebar staying open, you can now quickly click through different queries or organizer sections and see the results immediately in the main view without having to repeatedly reopen the sidebar.
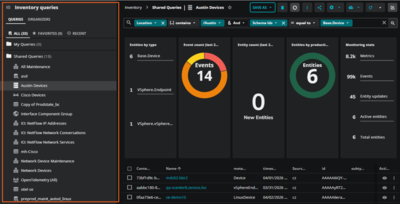
To learn more, see Inventory in Inventory.
We've improved the usability of exploring your Inventory data.
Previously, when you clicked on a filter in the Inventory summary view tiles, your only option was to completely reset the filter state. Now, you can undo the most recent filter application incrementally.
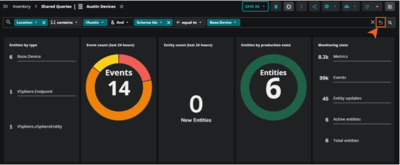
How it works:
When you click a summary view tile to apply a filter, a new Previous filter button appears in the query search bar.
Clicking this button removes the last applied filter, letting you step back one state at a time. You can continue clicking the button to undo filters until you return to the original query state, at which point the button disappears.
This enhancement allows you to safely drill down into your Inventory data using summary tiles and easily step back without losing all prior context, making it simpler to explore and analyze your data.
To learn more, see Inventory
Users can now select all available fields found in entities as columns, regardless of the inventory view type (new, saved, or template). This capability was previously limited to new queries, where users had to manually enable all available fields in the ADJUST COLUMNS panel.
To further improve usability, ADJUST COLUMNS now shows a divider to clearly distinguish between the default set of columns and all other existing entity fields. The selection process within the selector remains the same: selecting a column moves it to the visible columns section.
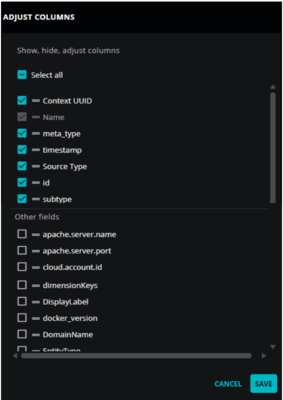
This month's updates include the following enhancements:
Smart View
We have added a new Explore more button to the Smart view toolbar to help you jump directly to the specific tools you need, such as Container Observability or Inventory. This feature saves you time by automatically showing the most relevant links based on the entity you are viewing.
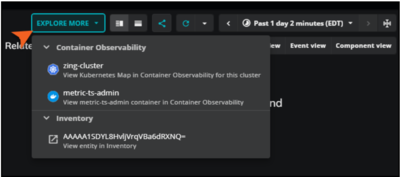
After you perform a search in Smart View, click the EXPLORE MORE button in the top toolbar to open a menu with links tailored to your current search results. The menu options are based on the type of data you are looking at:
Kubernetes entities: If you are viewing a cluster for Container Observability, you will see links to both Inventory and Container Observability.
CZ entities: If the entity is anchored in Collection Zone, you will see links to Inventory and CZ.
Standard entities: For all other searches, you will see a link to Inventory to view general configuration details.
The Inventory link opens in your current browser tab so you can stay within your workflow. Links to CZ and Container Observability open in a new tab, allowing you to compare data side-by-side without losing your Smartview search.
For more information, see Smart View.
The new Export Scheduler for Inventory is designed for users who need regular updates about their infrastructure health without the manual effort of repetitive downloads. Benefits include:
Automation: Set up a report once and receive it as often as you need.
Improved collaboration: Automatically share public inventory views with your entire team through email.
Direct access: Every export email includes a direct link back to the specific inventory view in Inventory, making it easy to jump from your inbox to the live data. Be sure that you are logged in to Virtana SO to view the query.
This feature is available to all users who have write permissions in Inventory. For more information about user roles and permisions, see Roles and Permissions.
Look for the new Scheduled exports option under the Export table button on any of your saved Inventory views.
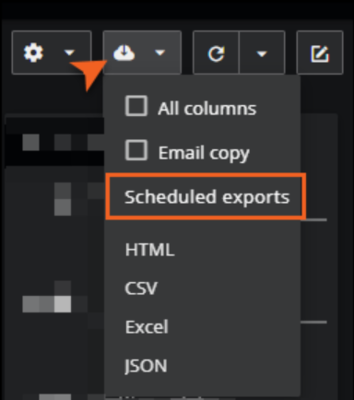
For more information, see Export query results in Inventory.
Past update notes
Looking for last year's feature releases? See 2025 update notes.