Viewing Performance Snapshot of Process in Host Map
The Performance Snapshot page describes the performance of a Process, its metrics health, and resource usage.
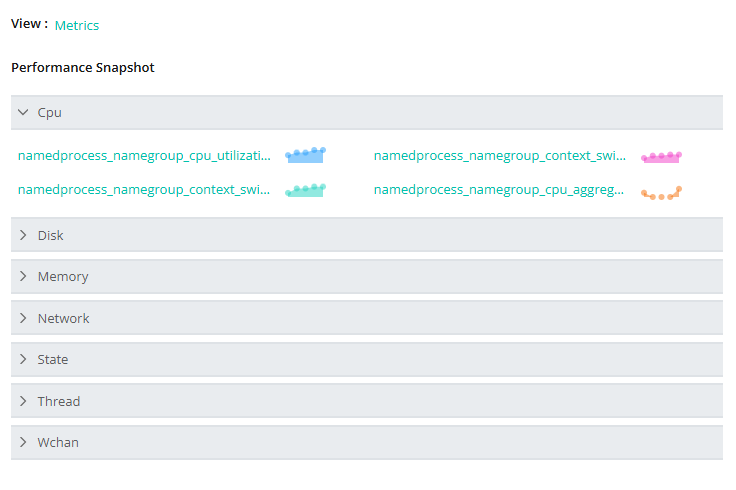 |
In Performance Snapshot:
Click CPU to expand the CPU entities of a process to monitor the performance.
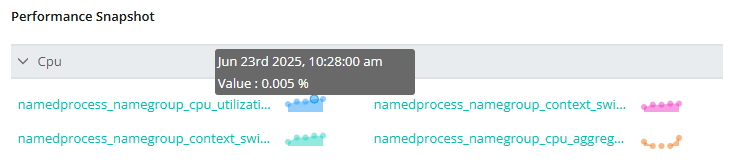
Hovering over each entity graph will display the network data transmitted/received at each time interval.
Click on any entity.
It will display the entity's threshold data for the process.
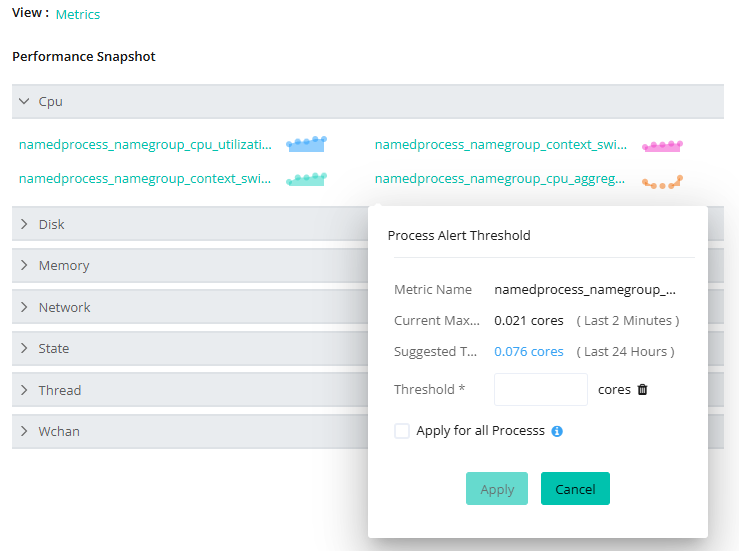
Host Alert Threshold shows the metric name, current maximum value, and suggested threshold value of each metric.
Define the specific value in the input field provided for the Threshold* and click Apply.
It notifies you of an alert when it exceeds the defined value.
Note
If the change impact is needed for all processes, check Apply for all Process.
Similarly, click on the Disk, Memory, Network, State, Thread, and Wchan to expand these sections.
Note
Similarly, you can view configuration and performance snapshots of Process Groups in the Host Map.
Under Performance Snapshot, you can view metrics and connections of process and process groups.