Application Dashboard
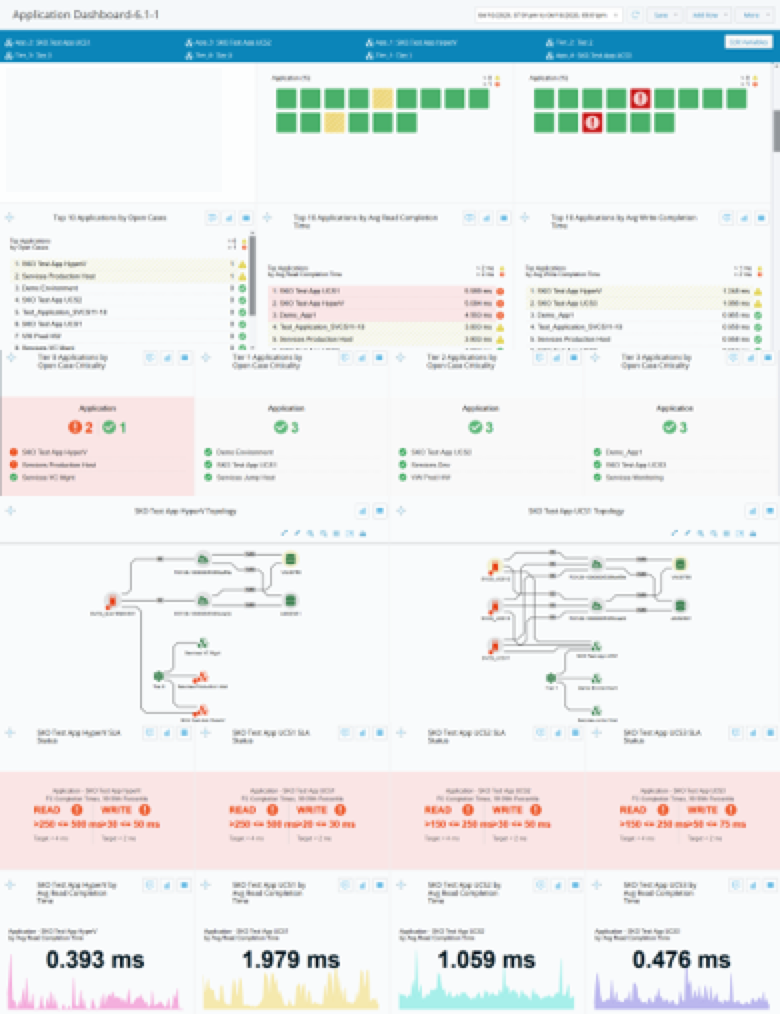
The Application Dashboard presents health and performance data for the applications.
Report Variables
You can filter the report for up to four applications and four tiers. Setting these variables allows you to compare data for your IO applications and tiers side-by-side.

Report Sections
The report is divided into the following sections:
Application Overview
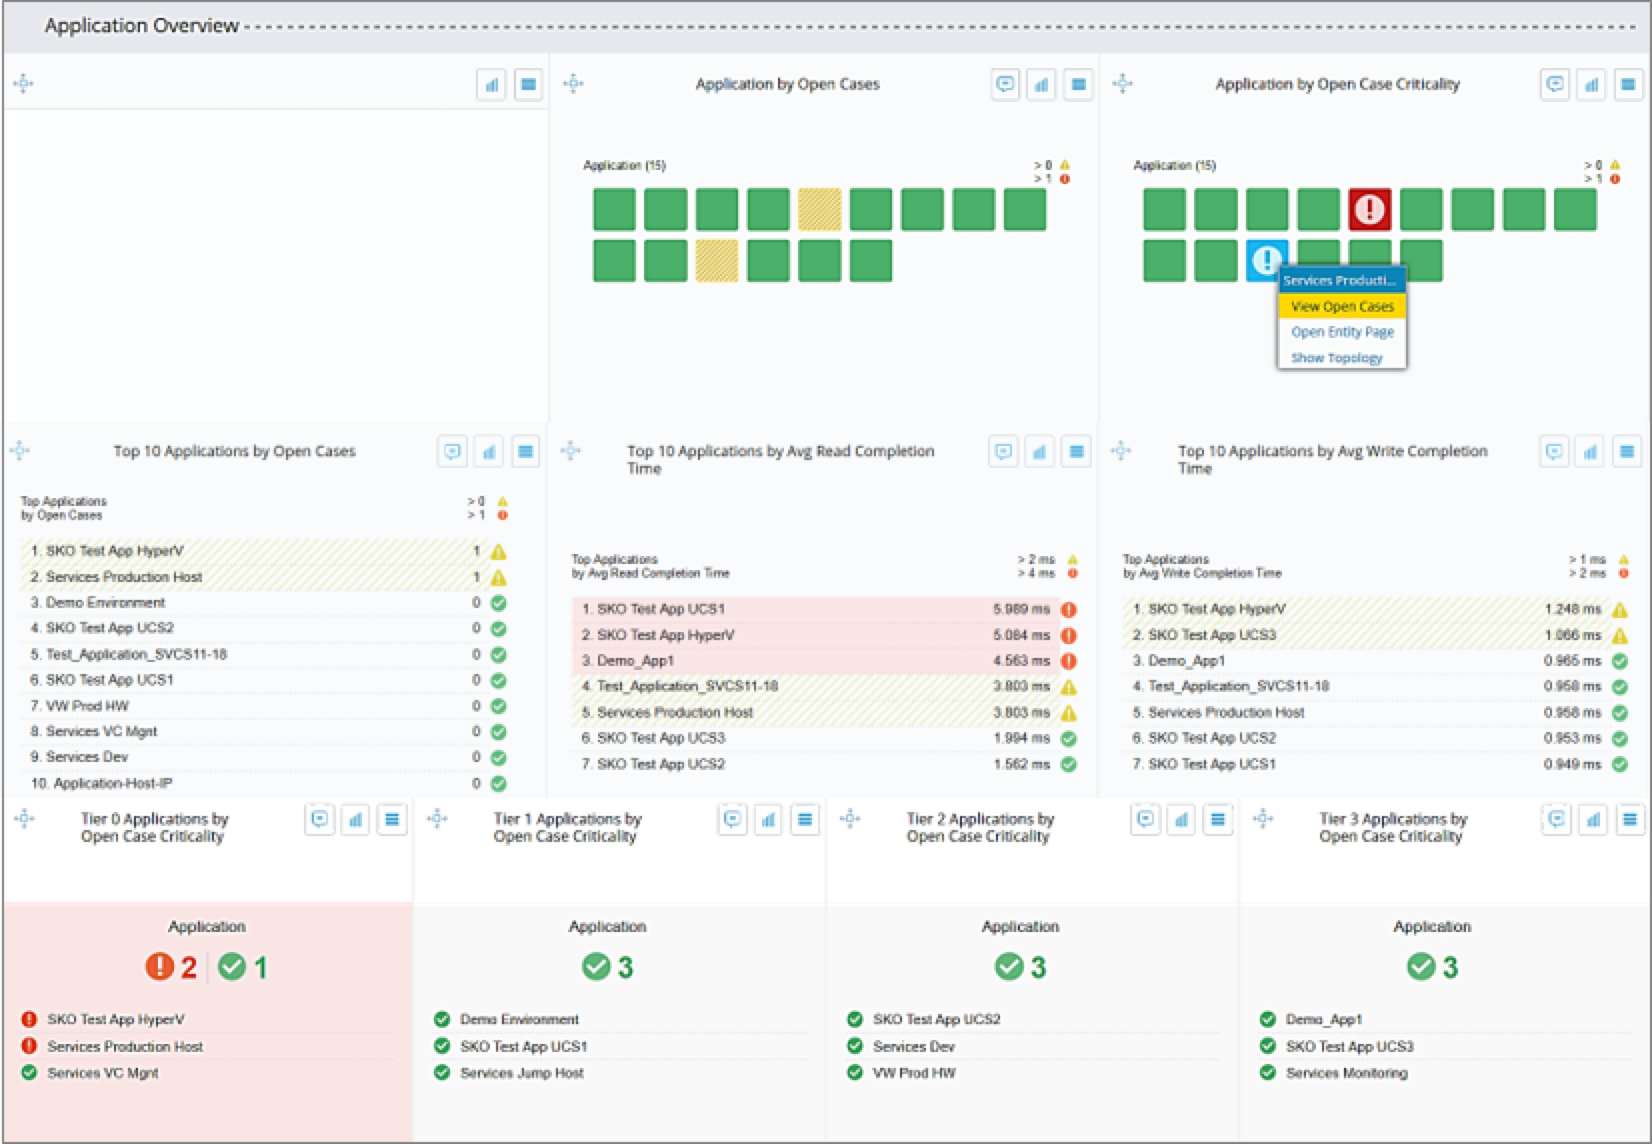
Use the Application Overview section to quickly observe which applications are experiencing issues.
Set the Tier variables to view summary health and performance data for applications.
View open cases to use the investigations to troubleshoot and remediate issues. Note applications with issues to use to filter the report.
Application Topology
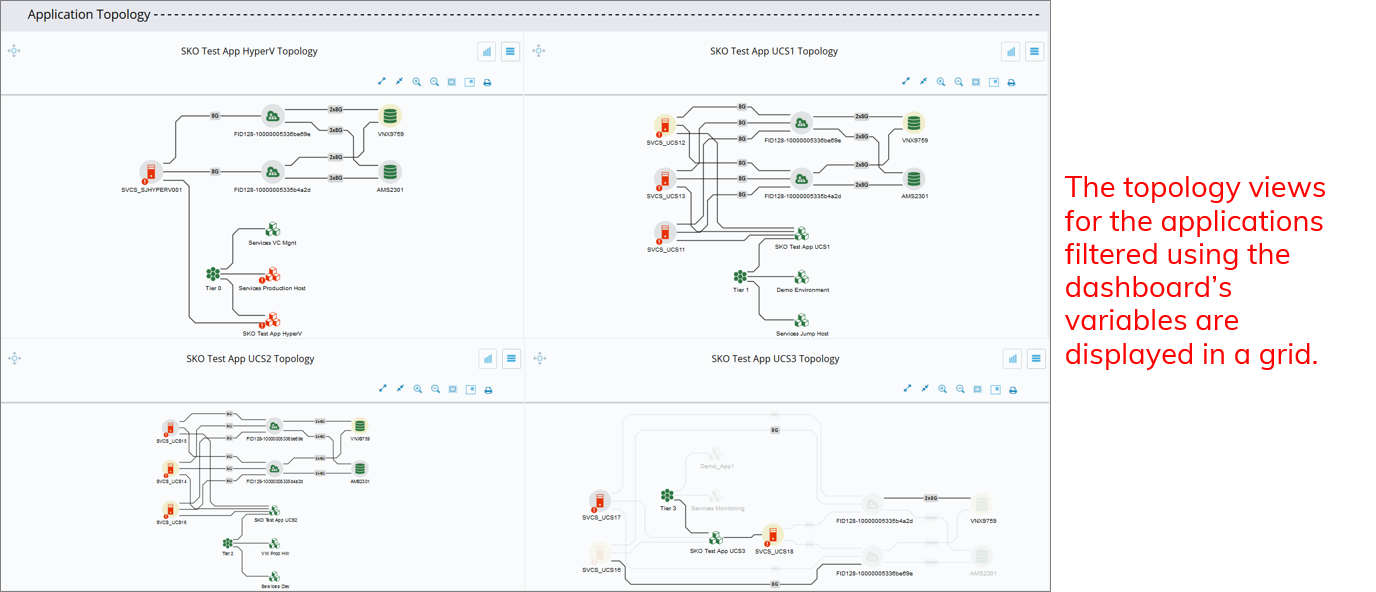
The Application Topology section shows the topology for up to four applications. Set the application variables to use this section.
Application Performance
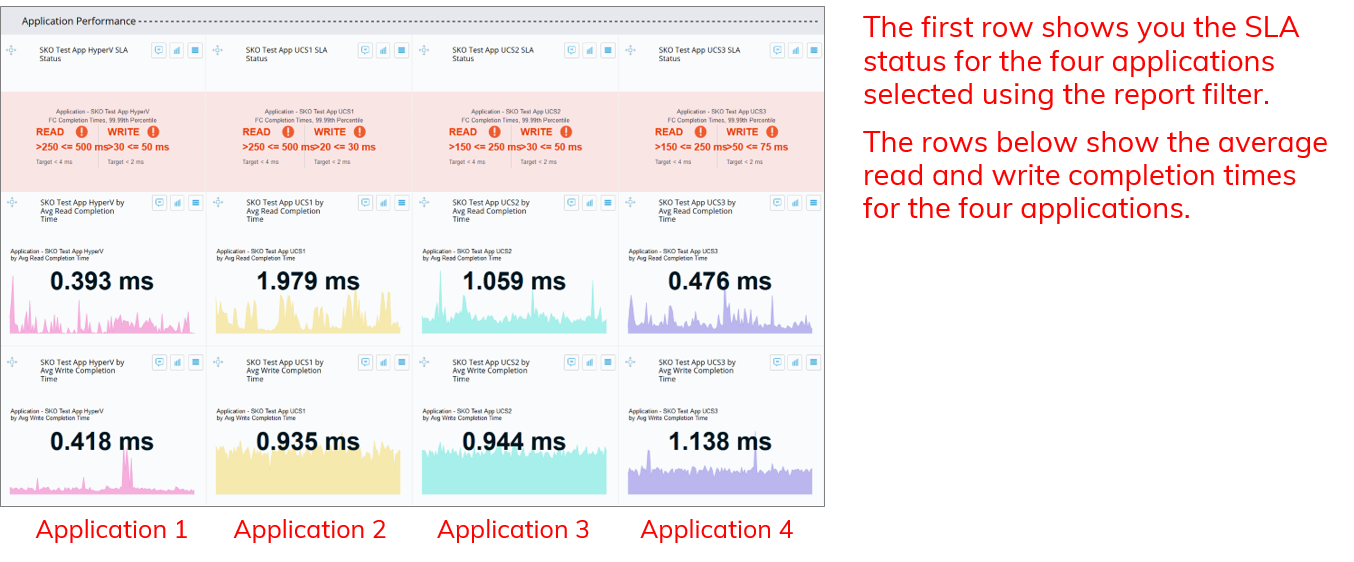
This section reports on SLA status and performance for up to four applications. Set the application variables to use this section.
Application Host Performance
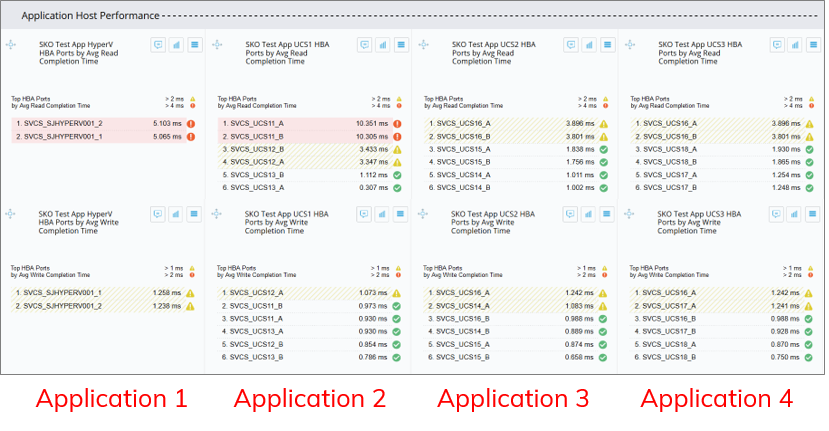
This section shows you the average read and write performance on the HBA ports of the hosts supporting the applications.
Report Quick Links
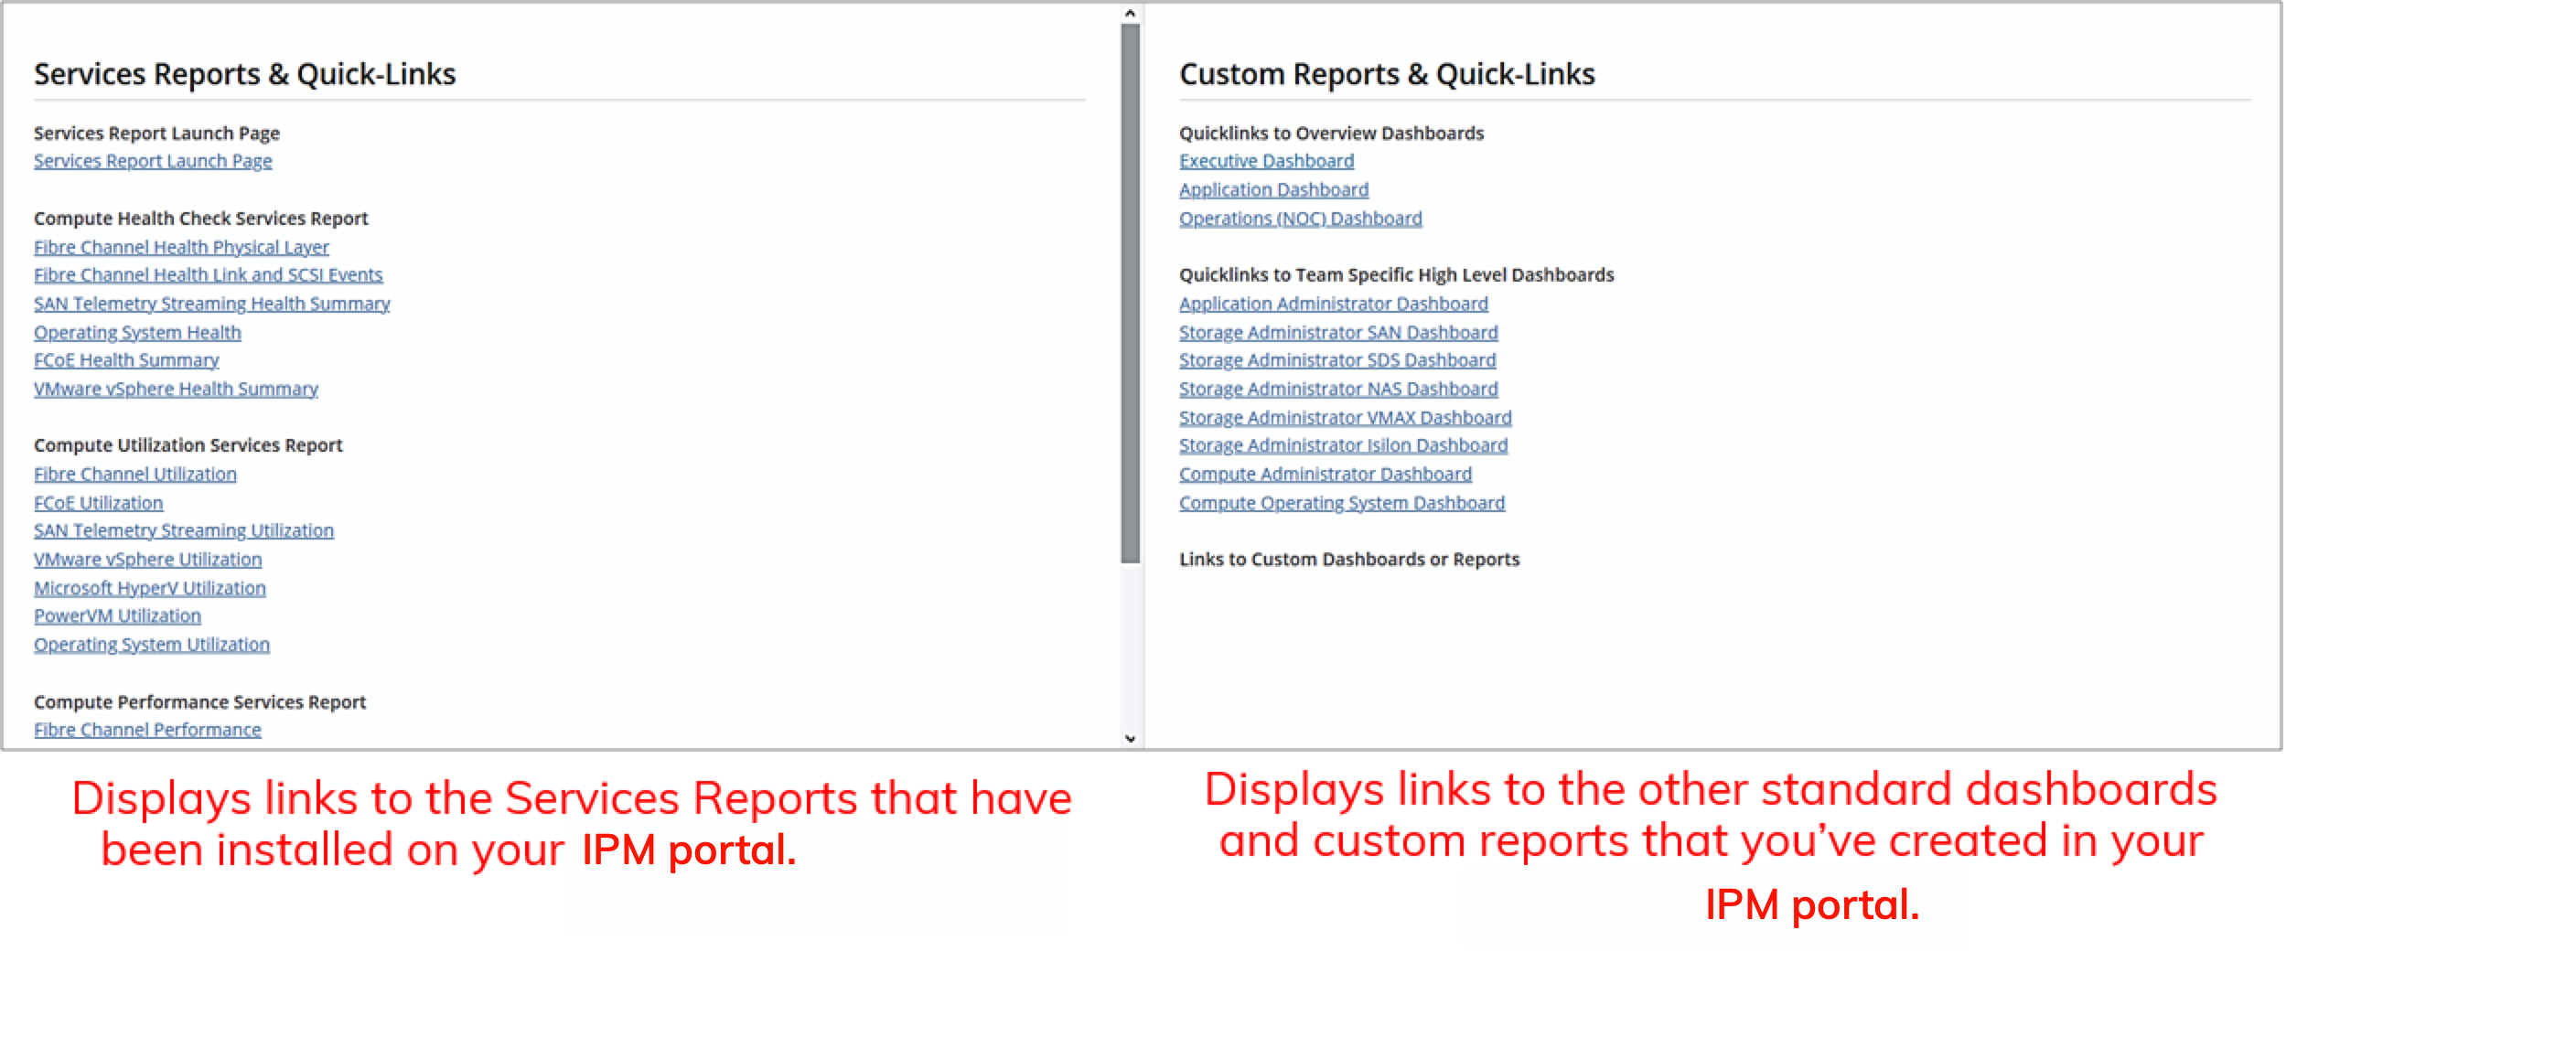
Use this section to view additional reports and dashboards.