
Workload Infrastructure Balancing Analytics

IO Workload Infrastructure Balancing analytics help you make decisions to balance your workload across the end-to-end infrastructure.
vmcoordinator.png

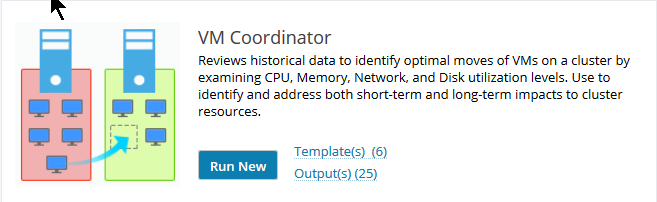
VM Coordinator improves VM cluster performance by making recommendations to move VM resources in order to better balance the hosts. VM Coordinator provides optimal placement for VMs across a cluster using historical trends. VM Coordinator generates a vMotion script that can be downloaded and run to move the identified VMs.
storageportbalancer.png

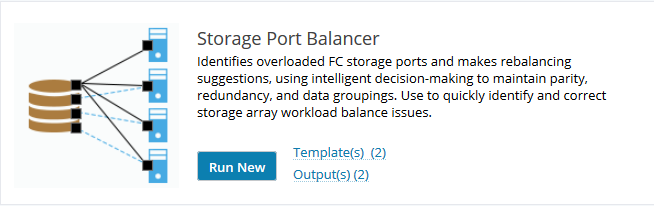
Storage Port Balancer identifies overloaded storage ports and makes HBA/Host move suggestions that would rebalance the front-end ports of a Fibre Channel storage array.
workloadrightsizer.png

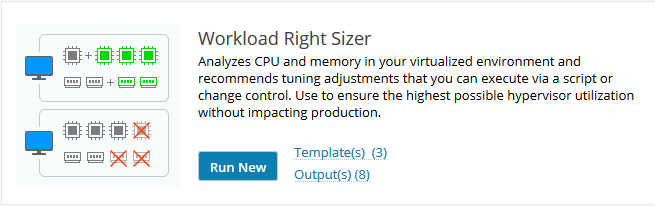
Workload Right Sizer analyzes virtual CPU and memory and recommends tuning adjustments that can be executed using a script or via change control
queuesolver.png

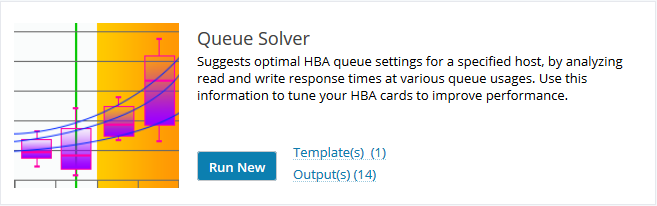
Queue Solver provides guidance in optimizing the settings for HBA queue depth. Queue Solver provides a visualization of the response time of that server as evidence for the recommendation.
vwanalytics-migrationanalysis.png

Migration Analysisanalyzes and exports data to enable application dependency, suggest ideal resource move groups, and provides insights for right sizing and optimizing cloud resources and costs, as part of a digital transformation migration project.
vwanalytics-workloadanalysis.png

Workload Analysis creates a workload simulation file that provides realistic workload simulations that can be replayed using WorkloadWisdom to assess and resolve issues or test new storage configurations.

VM Coordinator

Use VM Coordinator to review ESX cluster balance and identify optimal moves for existing VMS to improve utilization and performance.

VM Coordinator reviews historical data to identify optimal moves of VMs on a cluster by examining CPU, memory, network, and disk utilization levels.  Use VM Coordinator to identify and address both short-term and long term impacts to cluster resources

Running VM Coordinator

  1. Start by running a new VM Coordinator from the Analytics page.

    vmcoord.png
  2. Select the entity type to analyze by clicking on the Add box and selecting from the following entity types: ESX Cluster, ESX Host, Hyper-V Cluster, Hyper-V Host, or PowerVM Host.

    analytics-vmcoord.png
  3. Select the named entity to analyze.

    analytics-vmcoord2.png
  4. Set the Number of Swaps

    Set the parameter for the number of swaps. This limits the number of VMs that can be moved. The default number of swaps is five. The more moves you select, the longer it will take to run VM Coordinator.

    analytics-vmcoord3.png
  5. Selecting Advanced Options

    You can run the analytic using its default settings, or choose from its advanced settings.

    1. Check the Use Advanced Options box to display the advanced settings.

    2. The advanced options allow you to fine-tune the analytic to limit the network traffic and disk activity, the number of iterations allowed, and whether to optimize for CPU or memory or ignore DRS Affinity Rules (for ESX only).

      analytics-vmcoord4.png
  6. Setting the Date Range

    Run intervals may be based on cluster or ESX servers.  The longer the date range and iterations, the more accurate the resource balancing will be.

    analytics-vmcoord5.png

    The first run of VM Coordinator should be a minimum of 30 days, to catch monthly jobs on initial cluster rebalancing.  VM Coordinator should be run weekly thereafter, to maintain cluster balancing.

  7. Saving the Analytic as a Template

    Save the analytic as a template by selecting the Save button at the top right and schedule it as a monthly job.

    analytics-vmcoord6.png

Understanding VM Coordinator Results

The top section shows you how many VMs are recommended for moves, along with their names, and their suggested moves.

analytics-vmcoord7.png

Below is shown the projected impact on CPU and memory congestion, and disk and network usage.

analytics-vmcoord8.png

A list of the current measurement and projected impact for each host is shown below. Expand the details for a host by clicking the down arrow.

analytics-vmcoord9.png

Download vMotion Script

Recommendations from VM Coordinator will require you to move several virtual machines using a vMotion script.

If you decide to use the recommendation, you must perform all the recommended moves. Performance may be negatively impacted if only some of the moves are made.

To download the script produced by VM Coordinator, select More, then Export.

analytics-vmcoord10.png

Storage Port Balancer

Storage Port Balancer identifies overloaded storage ports and makes HBA/Host move suggestions that would rebalance the front-end ports of a fibre channel storage array.

Running Storage Port Balancer

  1. Start by running a new Storage Portal Balancer from the Analytics home page by clickingClick the New Analytic or Run New button.

    stgportbal.png
  2. Click the Add button to select a storage array.

    stgportbal1.png
  3. Select a storage array from the list. You can use the search box to find a specific storage array. Click the OK button.

    stgportbal2.png
  4. Use the slider to specify the Number of HBA Swaps. The number allows you to limit the number of HBAs that can be required to be moved as part of the recommendations. The default is eight.

    stgportbal3.png
  5. Select the maximum desired read and write utilization post-move. The default value is 50%. Note that the desired utilization has been set low in this example to show results.

    stgportbal4.png
  6. If you click the Use Advanced Options check box (off by default), you can select additional check boxes (also off by default) to:

    • Avoid Ports Dedicated to Replication

    • Exclude Ports with No Traffic

    • Exclude Select Ports

    If you check Exclude Select Ports, the Exclude Storage Ports screen is displayed, and you can select one or more ports to exclude.

    stgportbal5.png
  7. Click the Run button.

Understanding Storage Port Balancer Results

The recommendation for the selected array(s) is displayed, with a number of HBA swaps and a projected efficiency percentage change. If a more optimal configuration was not found based on the selected parameters, a dialog box is displayed suggesting parameter changes.

stgportbal6.png

Click on the down arrow next to the HBA name to view more information about the swap.

stgportbal7.png

You can save the move recommendation by clicking on the hamburger icon in the recommendations header, then exporting as a csv file or copying to the clipboard.

stgportbal8.png

Workload Right Sizer

Workload Right Sizer analyzes CPU and memory in your virtualized environment and recommends tuning adjustments that you can execute via a script or change control.

Running Workload Right Sizer

  1. Start by selecting the entity type to analyze: Application, Nutanix Host, Nutanix Virtual Machine, Nutanix Cluster, KVM Host, KVM Virtual Host, ESX Cluster, ESX Host, or ESX VM, then select a named entity from the dropdown list. The following is the sample screenshot of the entity type.

    workloadrightsizerselectentity.png
    workloadrightsizerselectentity2.png
  2. You can choose to use advanced options with Workload Right Sizer by checking the Use Advanced Options box. For example, you can change the CPU and memory over-subscription ratios, which are set to 2:1 by default.

    You can select whether a higher tier VM gets precedence for resources if there is a conflict.

    You can also set acceptable usage thresholds for vCPU and VM memory usage. This identifies candidates for right sizing.

    workloadrightsizeradvanced.png
  3. You can also over-ride the thresholds for a specific tier. Say you wish to right size the Bronze tier differently than other tiers and select candidates based on different thresholds. You can do this by selecting “Override Thresholds by Tier”, selecting the tier and setting the usage thresholds to different values.

    workloadrightsizeradvancedtier.png
  4. Set the date range for the analytic. When running Workload Right Sizer for the first time, choose a range where the entities have been in the same state. After the analytic is run for the first time, it’s advisable to run it monthly.

    workloadrightsizerdate.png
  5. You can save analytics in the same way you can save a report and schedule them to run periodically. Save the analytic as a template and schedule it as a monthly job.

    workloadrightsizersave1.png
    workloadrightsizerschedule.png
  6. You can run the analytic in the background and view its output later on the Outputs page.

    analyticsbackgroundjob.png

Understanding Workload Right Sizer Results

The top section shows you how many VMs were analyzed and a summary of the recommendations in terms of VM to grow, shrink, or a combination of both. Links to download the Right Sizer script or to submit a change request via the ServiceNow integration are also provided here.

workloadrightsizerrecommendationsummary.png

The Virtual Machines tab shows a list of the analyzed VMs and recommendations for vCPU and memory. You can expand the results for each VM by clicking the down arrow next to its name. The results can be sorted by name, priority, or open change request.

Three additional tabs share analysis and recommendations grouped by hosts, clusters, and applications.

workloadrightsizerrecommendationdetails.png

You can download a script to make the recommended changes.

workloadrightsizerdownloadscript1.png

You can also initiate and track ServiceNow change requests (requires the ServiceNow integration).

workloadrightsizercr2.png

Queue Solver

Queue Solver provides guidance in optimizing the settings for HBA queue depth. It enables you to maximize SAN traffic queue depth without hitting the avalanche point of backlogged requests that slows host response time.

Note

Queue Depth refers to submitted but unanswered read or write requests.

queudepth.png

The analytic displays a graph of the inferred queue depth vs. read or write acknowledgement latency, and provides one of four recommendations about queue depth:

  • No change to the queue depth limit proposed.

  • It has been determined that the queue depth limit should be lowered. Lower it to {x}.

  • Based on this data set, it was determined that the queue depth limit is too low. If you feel the chosen data range represents normal operation, your system might benefit from raising the queue depth limit. Proceed with caution in incremental amounts.

  • Based on this chosen time range, your queue depth limit setting looks fine. You might see some gains if you lower the queue depth limit to {x}; however, the time gains might not be significant or noticeable.

The Queue Solver analytic examines network traffic for an HBA card, but does not directly read the current queue depth from the HBA BIOS.

To create a Queue Solver analytic:

  1. Start by running a new Queue Solver from the Analytics home page by click the New Analytic or Run New button.

    queuesolver1.png
  2. Click the Add button to select a host or ESX host to analyze.

    queuesolver2.png
  3. Select a Host or ESX Host, then click the OK button. You can use the search box to filter the display of Hosts/ESX Hosts.

    queuesolver5.png
  4. Run Queue Solver for at least two weeks, making sure to select a date range that is a good representation of your business cycle, e.g., includes month-end processing.

    queuesolver4.png

    Subsequent runs should be made after queue depth settings have been changed.

  5. Click the Run button.

  6. If the host does significantly more writes than reads, click the Write-Based Recommendations radio button.

    The queue solver analytic screen is redisplayed, showing the write-based recommended action to be taken on the queue depth setting. In this case, the read- and write-based recommendations are different.

  7. You can click the percentile legend selections to show only some or all of the information.

    Only the selected percentile curve is displayed.

  8. Hover over the graph lines to display detail information.

  9. To export a copy of the displayed graph, click the options menu (horizontal bars), and select the Export format from the displayed menu.

Understanding Queue Depth Results

Two graphs are displayed at the bottom of the page for Read and Write-based recommendations. You can toggle between the recommendations using the radio buttons.

A summary of the recommendation is displayed at the top.

The charts present the Avg Read Latency or Avg Write Latency along the y-axis, and the inferred queue depth along the x-axis. As expected, latency increases with queue depth as port utilization increases.

queuesolver6.png

Hover over a box to display percentile values for the box charts.

queuesolver7.png

Important

When you implement Queue Solver recommendations, examine the potential impact of the change on other devices sharing the same target storage controller, especially different HBA queue depth settings to the same controller port.

A single HBA with a significantly lower queue depth setting than the other HBAs sharing the controller can result in proportionally less work done, with a potential degradation of throughput for that host.

Therefore, if a large queue depth reduction is recommended for a single HBA, carefully consider reducing the queue depth setting for all HBAs sharing the storage port.

If a host has multiple HBA cards, the same queue depth should be specified for all the HBAs.

Migration Analysis

The Migration Analysis analytic is used to prepare data collected by IO for use in Virtana Platform "VP" Workload Placement. Application and device mappings, and inventory, network, workload and other data is collected and organized into a zip file that can be downloaded from IO.

Once you have configured a connection to VP (refer to IO Administrator Guide > Installation and Configuration > Virtana Platform Connectivity for more information), the collected and organized data can be sent directly to VP Workload Placement. Migration Analysis makes it possible for you to use the most realistic data possible, collected from your production infrastructure, to complete cloud migration readiness assessments and other digital transformation projects using VP.

Important

If you plan to incorporate custom pricing in the Workload Placement calculations, you must follow the steps below for downloading the migration files. See Adding Custom Pricing for Migration for more information.

Running Migration Analysis

  1. Start by running a new Migration Analysis by clicking the New Analytic or Run New button.

    vwanalytics-migrationanalysis.png
  2. Select the types of data you wish to export.

    There are two options. First, if connectivity to VP has not yet been configured, as shown below in the left-hand image, you select which data you want exported: Inventory, Resource Utilization, or NetFlow Conversation data. If connectivity to VP has been configured, as shown below in the right-hand image, the form will already be filled out according to the VP connection settings.

    NetFlow Conversations include both NetFlow and netstat conversations.

    Tip

    If you plan to import the data into VP Workload Placement, you must check all three data types. This will be done by default as shown below if you have already configured a connection to VP. Uncheck the Send Data Directly to VP Workload Placement (Org) checkbox to be able to select the desired data types.

    vwanalytics-migrationanalysis2a1.png
    vwanalytics-migrationanalysis2a.png
  3. Select a time range for the export by clicking on the date field.

    The ideal date range for extracting the most granular data (5-minute) is 30 days. The granularity of data extracted for ranges over 30 days will be based on IO's data persistence policy.

    vwanalytics-migrationanalysis3.png
  4. Click Prepare Export to start the export process if VP connectivity has not yet been configured. Otherwise, click the Send to VP Workload Placement button.

    The process runs in the background. You can choose to be notified when it is complete by checking the Notify me when completed box.

    vwanalytics-migrationanalysis4.png
    vwanalytics-migrationanalysis4b.png

    A message is displayed when the analysis is complete. Two possibilities exist as shown below. The left-hand picture depicts what is displayed when VP connectivity is not configured. In this case, click the Download Results button to download the file. The right-hand picture depicts what is displayed when VP connectivity is configured. For this case, downloading is optional, as the data has already been pushed to VP Workload Placement.

    migrationanalysisdownloadresults.png
    migrationanalysisdownloadresultsd.png

    Tip

    After the results of Migration Analysis have been sent to VP Workload Placement, IO will retain the results until Migration Analysis is run again. Once it's run again, the previously stored results data will be overwritten with new data. If you wish to retain a copy of the results data, you should download it for safe keeping.

Adding Custom Pricing for Migration

If you have custom pricing with a Cloud Service Provider (CSP), you can include that custom pricing so that Workload Placement can use it for on-premise cost calculations, instead of the general CSP pricing.

About This Task

To use custom pricing, you must download the Migration Analysis file set, modify one of the CSV files, and upload all the files to Virtana Workload Placement.

Important

After the CSV file is uploaded to Workload Placement, the prices cannot be updated in that file. You would have to update and upload a new set of Migration Analysis files.

Prerequisites

Follow the instructions for downloading Migration Analysis files.

Steps

  1. Uncompress the Migration Analysis archive file.

    The archive file is downloaded to the location set as your default download folder in your browser. The file name will be similar to this example:

    Collection_2021_10_08_2021_10_22_2021_10_22.zip

  2. Open the custom_price_list.csv file.

    The file is located at migrate-data/vm_inventory/io_inventory/host_info/custom_price_list.csv.

    Example of a completed custom_price_list.csv file:

    vw-mig-analytic-custom-pricing-csv.png
  3. Add appropriate content to the following columns:

    • CapEx: Dollar amount of CapEx for the host (hardware plus software); excludes storage. For vi-02.local in the example above, the CapEx value is $9000.

    • Opex_per_year: Dollar amount of operational expenses for the host per year. For vi-02.local in the example above, the Opex per year value is $500.

    • LifeTime: Lifetime of the host, in months, over which the CapEx is to be amortized. An entry of -1 means 36 months. In the example shown above, all LifeTime values are 36 months.

    • storageCost: Dollar amount of storage cost for the host. For vi-02.local in the example above, the storageCost value is $200.

    If values are not provided for a host, default cost values based on industry averages will apply during Workload Placement calculations.

  4. Recompress all of the Migration Analysis files.

  5. Upload the files to Workload Placement following the instructions for creating a project in Virtana Platform.

Related Topics

Migration Analysis

Workload Analysis

The Workload Analysis analytic is used to prepare and transfer workload data collected by IO probes into WorkloadWisdom.   Workload data is analyzed and grouped by IO and a file is prepared for download.  Workload Analysis makes it possible for you to use the most realistic data possible, collected from your production infrastructure to perform validation and testing of storage using WorkloadWisdom.

Running Workload Analysis

  1. Start by running a new Workload Analysis by clicking the New Analytic or Run New button.

    workanalysis1.png
  2. Click Add to select the entity to be analyzed.

    workanalysis3.png
  3. Select an entity type and entity.

    workanalysis4.png
  4. Specify a full export or an export with calculated clusters, groups of similar data profiles.

    The full export generates a large raw file, and the clustered option produces a smaller file, with the Advanced Options of either auto-detecting or limiting the maximum number of clusters.

    Select the protocol using the radio buttons.

    workanalysis5.png
  5. If exporting calculated clusters, check the Use Advanced Options and choose to auto-detect or limit the maximum number of clusters to a specified value.

    The default setting is to limit the maximum number of clusters to eight.

    workanalysis6.png
  6. Click the Prepare Export button.

    The file is generated.

  7. A message is displayed when the analysis is complete. Click the Download Results button to download the file.

    workanalysis7.png