- Virtana Docs
- Virtana Platform
- Virtana Platform Getting Started
- Navigating Virtana Platform
Navigating Virtana Platform
Virtana Platform provides a single web console with modules for observability and cost management. From the same interface, you can also manage users, licensing, integrations, branding, and governance policies.
After logging in, you land on the Virtana dashboard with the top title bar, left navigation menu, and main content area visible.

Top global header
The top bar is used for global navigation and context:

Virtana Logo: Located on the left, it identifies the application.
Environment selector: Displays the active environment (for example, Virtana Green) and allows you to switch between environments.
Modules
Global View: Provides an organization-wide perspective across all environments.
Container Observability: Use telemetry data to gain deep insights into the health and performance of your containerized applications and microservices in real time. Proactively identify the root causes of issues in your container environments. o
Infrastructure Observability: Enables in-depth monitoring of physical, virtual, and cloud infrastructure, and provides real-time alerts to ensure optimal system health and performance.
Cost Management: Supports financial optimization and cloud spend analysis.
Service Observability: Access real-time, service-level visibility across your IT stack so your teams can manage the health of your service and triage incidents.
Settings Icon: Provides access to platform configuration and preferences.
User Profile: Displays the logged-in user and provides access to account-related options.
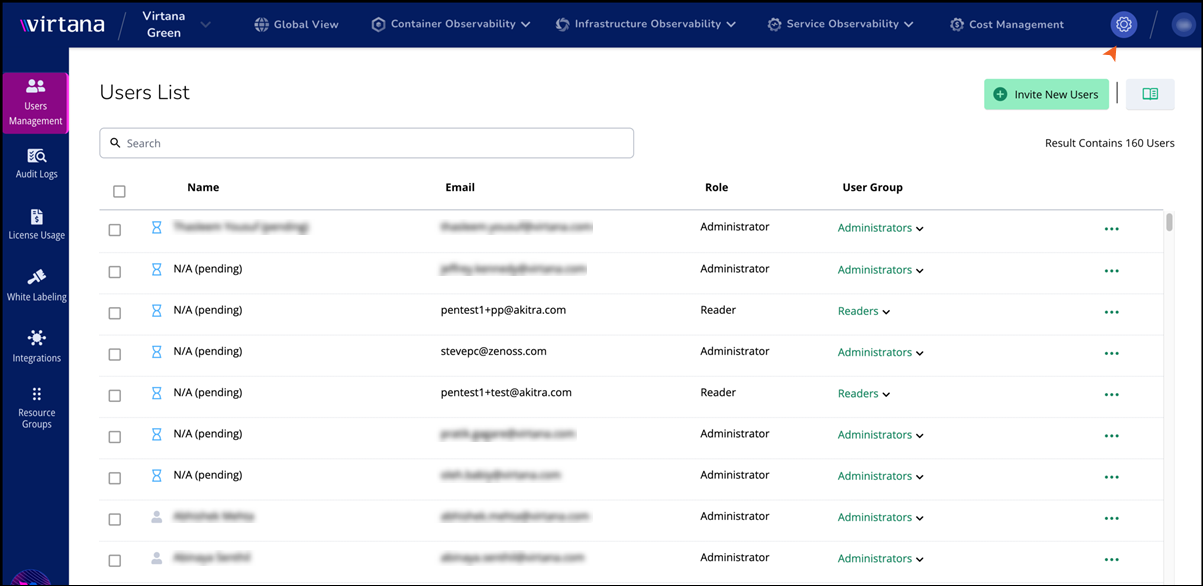
Left navigation menu
Go to Settings, and you can view the following menu. The left navigation panel provides access to administrative and configuration options, as follows:
Users Management
Use Users Management to configure who can access the Virtana Platform and what they can do.
From the Users Management sidebar item, you can view a submenu that includes:
Users – Manage individual user accounts, including basic details, roles, and access status.
User Groups – Create and manage groups of users that share the same roles and data access.
Data Access Groups – Define which environments and resources specific users or groups are allowed to see.
SSO Configuration – Configure and manage single sign-on settings for your identity provider integration.
To view User Management in more detail, see User Management in Virtana Platform.
Audit Logs
Use Audit Logs to track user and system activity across the Virtana Platform. On the Audit Summary page, you can view:
Filter logs by time range using Show logs for (for example, Current Month).
Search audit entries using the search field.
The table presents key activity details, including the timestamp, user, source IP, source type, action identifier, and status. It also lists the related resource type, resource name, and a brief description, making it easy to review and understand each logged action.
To view Audit Logs in more detail, see Audit Logs.
License Usage
Use License Usage to understand consumption of Virtana licenses over time. When you select License Usage in the left sidebar, the main page shows:
A view selector at the top of the chart that includes Cost Management and Infrastructure Observability.
A License Usage: by Month/by Day
VM count on the Y‑axis.
Time on the X‑axis.
Allocated VMs and average VM count for each month.
A Last Month summary that shows allocated VMs and average VMs.
A Monthly Allocated VMs table below the chart with month, allocated VMs, and average VMs.
To view License usage in more detail, see License Usage Reports.
White Labeling
You can use White Labeling to customize how the Virtana Platform appears to your users.
Themes: The Themes tab lets you configure the look and feel of the user interface and associated emails.
Domain Settings: This setting lets you choose how users access the platform and how the login page is branded. You must configure domain settings correctly before users can reach your branded login page.
To view White Labeling in more detail, see White Labeling Virtana Platform.
Integrations
Use Integrations to connect Virtana Platform to external data sources and systems. When you select Integrations in the left sidebar, a menu appears that includes:
Virtana Platform API: Generate and manage API credentials so external tools can programmatically access Virtana Platform data and actions.
Cloud Providers: Connect cloud accounts to ingest billing and usage data for analysis, optimization, and reporting.
Metrics Collectors: Configure collectors that send performance and utilization metrics to Virtana Platform for right-sizing and observability.
Change Management: Integrate with your change management system so cost and optimization recommendations can create or link to change tickets.
Action Integrations: Connect automation and notification systems to execute remediation actions or alerts directly from Virtana Platform.
Resource Groups
Use Resource Groups to logically group resources for reporting, access control, and policy assignment. On the Resource Groups page, you can view:
A search field at the top to filter resource groups.
An Add Resource Group button.
The table displays each Resource Group along with its description, entity count, and the status of both infrastructure and container observability. It also includes details about who created the group and when it was last updated. An actions menu is provided for each entry to support quick management tasks.
To view Resource Groups in more detail, see Resource Groups in Virtana Platform.
Main Content Area
The main content area displays the details of the selected feature. For example, in the Users Management section, you can view a search bar for users and can view user details such as name, email, role, and group.
It changes based on the item you select from the top header or left sidebar. Pages typically include a search bar, filters, action buttons on the upper‑right, and a table or configuration panel.
Use the Settings
or user profile in the top-right corner to manage platform settings and your account.