Summary
The dashboard provides a summary view of the status of the cluster; the number of alerts raised, resource usage, and service performance.

Alerts - These are classified as follows:
Open Alerts
Working Alerts
Hold Alerts
Resolved Alerts
Closed Alerts
Total Alerts
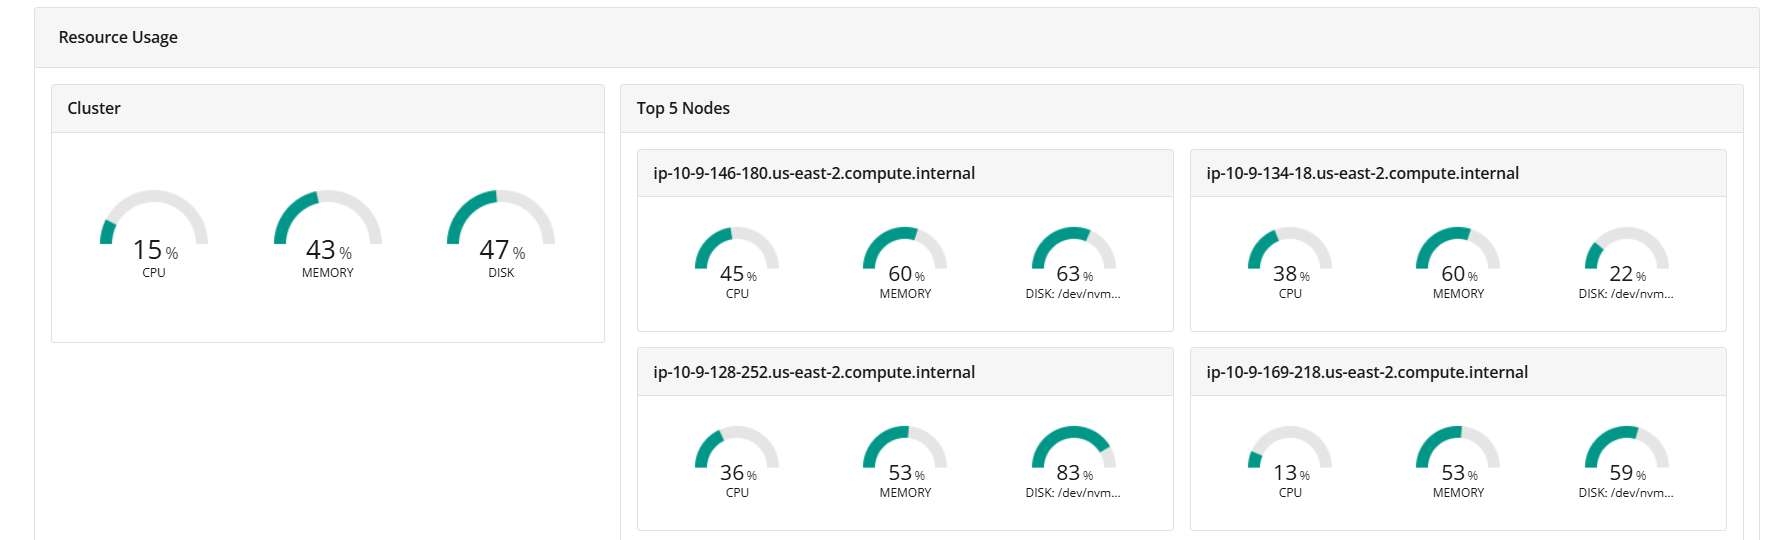
Resource Usage - Provides a summary view of resource usage of cluster and top 5 Nodes with high resource usage from the cluster.
Top Service Deviations - Displays the service performance dashboard data and the associated service-level performance details.
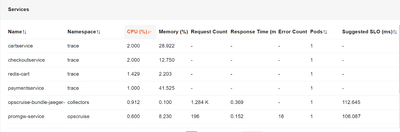
The Top Service Deviations widget is categorized by three metrics:
By Latency: Lists the services with latency deviations.
By Error Rate: Lists the services showing notable error rate deviation.
By Request Count: Lists the deviations in request count.