Network Setup and Utilities
The Network Setup and Utilities features lets you configure the Virtana Infrastructure Observability network.
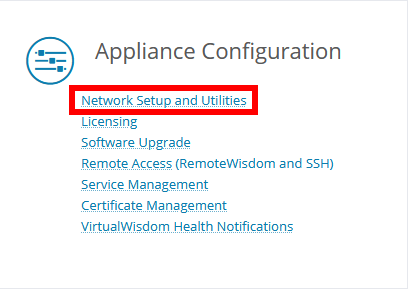
Select Network Setup and Utilities from the Settings screen to modify the appliance's network settings.
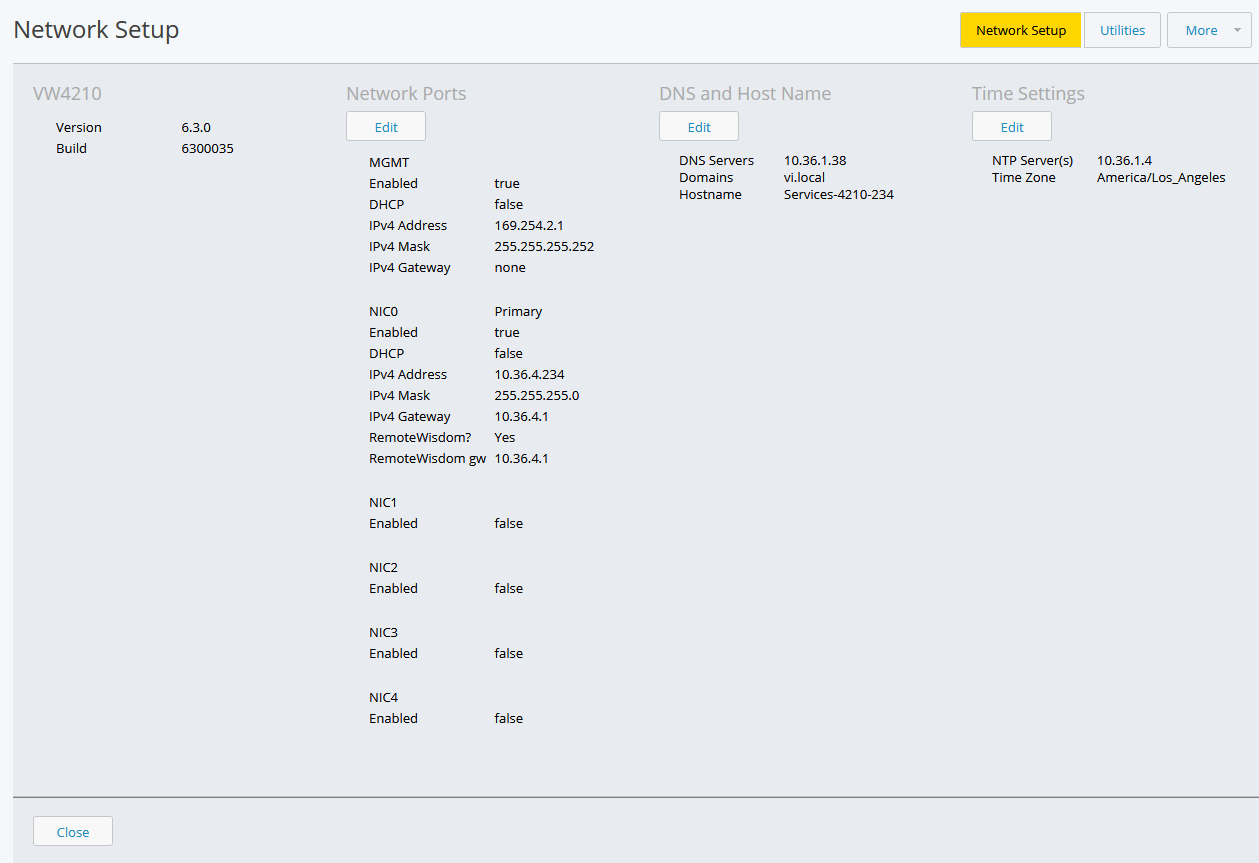
The Network Setup page is displayed. This manages the configuration for a single NIC. See Configure Multiple NICs for information on configuring more than one NIC.
Note
If you are deploying an OVA for the Virtana Infrastructure Observability Virtual Editions, the Network Ports section of the Network Setup screen contains information for only the NIC0 port. The MGMT port as well as NIC1, NIC2, NIC3, and NIC4 do not apply to the Virtual Editions. See the Virtana Infrastructure Observability Virtual Edition Guide for more information.
You can edit the following network settings for the appliance:
DNS address
Domain name
Hostname
Important
Be sure to use a fully-qualified domain name (FQDN) if you're using certificate based on a FQDN. Otherwise, URLs that are generated for case email alerts, etc., will give an error when clicked.
Language
NTP
Note
It is imperative that all IO data sources are synced to the same NTP sources that will be configured in IO, otherwise the platform might reject data. If syncing is not possible, then a data source’s time should be set to the same time as Infrastructure Observability IO.
Note
In the Time Settings section, click Edit, then click Current Status. Result: Virtana IO opens the Info window and lists the status of each configured NTP server.
Timezone
Note
As specified in the Virtana Infrastructure Observability Platform Appliance Guide, it is recommended that you set the time zone to the one in which the Appliance is deployed.
NICs 0-4, and their associated DHCP or static IP settings
Warning
If you change from static IP to DHCP connectivity as part of the network configuration of the Virtana Infrastructure Observability appliance, the DNS settings are not updated by DHCP. You must manually update the DNS settings.
Configure Multiple NICs
When you first set up your Appliance, you specify the configuration for NIC0 using the MGMT port. NIC0 is active by default and cannot be disabled. You can configure any, none, or all of the following NICs: NIC1, NIC2, NIC3, and NIC4. The example in this section configures NICs 1-4.
To configure the Appliance:
From the Settings screen, click Network Setup and Utilities.
The current settings for IO4210/4220, Network Ports, DNS and Hostname, and Time and Region are summarized on the Network Setup page.
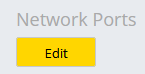
Click the Edit button corresponding to Network Ports.
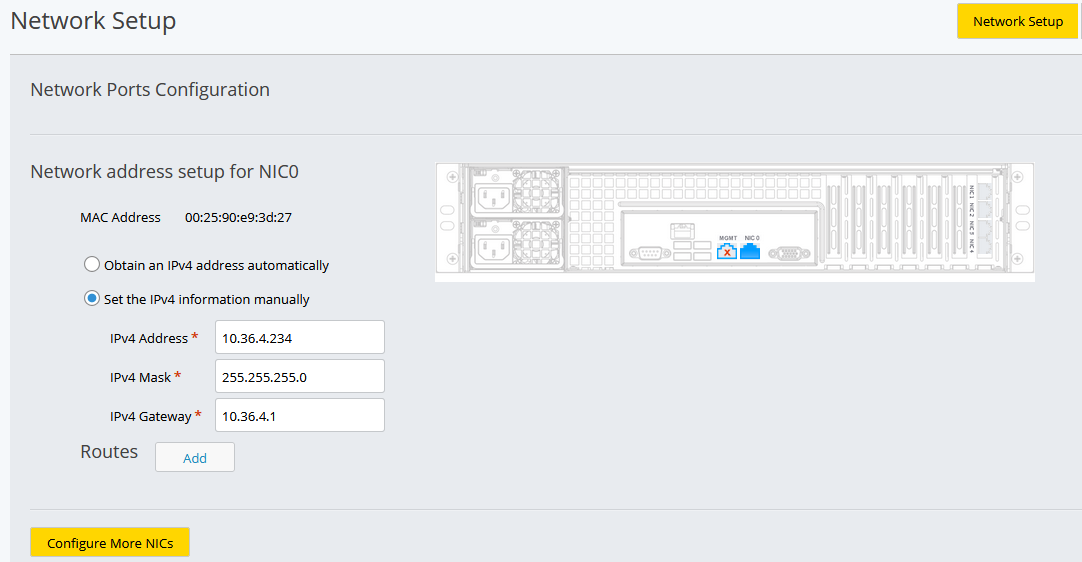
The Network Ports Configuration page displays. Click the Configure More NICs button.
The screen area is displayed below the setup for NIC0 and above the Configure More NICs button.
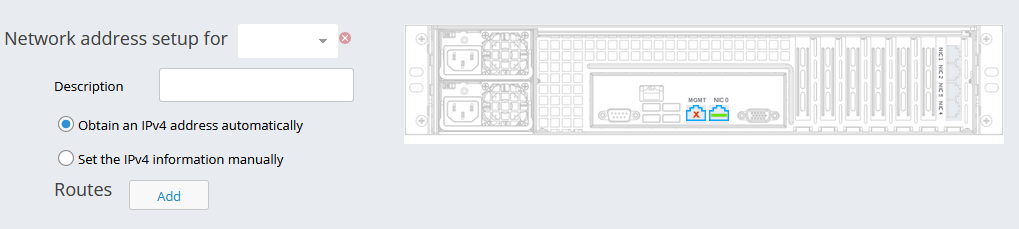
You can click the “x,” to the right of the Network address setup for drop down to remove the NIC configuration from the system.
The Obtain an IPv4 address automatically radio button is selected by default. Use this button to configure the Appliance using DHCP.
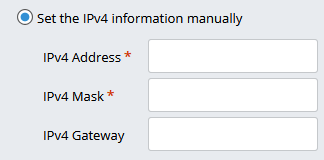
If you want to configure the Appliance using a static IP address, select the Set the IPv4 information manually radio button. Selection of this radio button displays the IPv4 address, IPv4 mask, and IPv4 gateway fields.
Warning
If you change from static IP to DHCP connectivity as part of the network configuration of the Virtana Infrastructure Observability appliance, the DNS settings are not updated by DHCP. You must manually update the DNS settings.
Start by configuring NIC1:
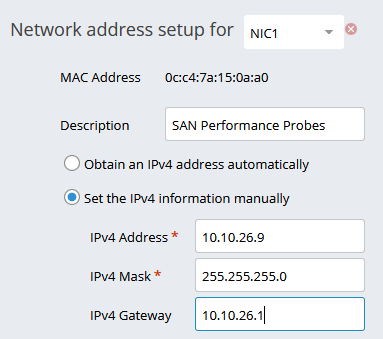
Select NIC1 from the Network address setup for drop down menu.
Enter a Description for the NIC.
In this example, the description for NIC1 is “SAN Performance Probes.”
Select the Set the IPv4 information manually radio button and enter the information for the IPv4 address, IPv4 mask and IPv4 gateway fields.
In this example, the IPv4 address is 10.10.26.9, the IPv4 mask is 255.255.255.0, and the IPv4 Gateway is 10.10.26.1.
Click the Configure More NICs button to configure another NIC. Each time that you click this button a new NIC configuration screen displays.
Repeat Step 6 for each NIC that you want to configure.
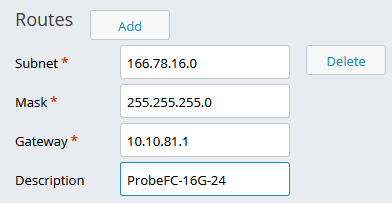
Add the routes for the NICs you added. In this example, we'll add the route for NIC1. Click the Add button next to Routes.
Enter the route information (subnet, mask, gateway, and description) and click Save.
The Info dialog displays. The appliance restarts and returns you to the Virtana Infrastructure Observability login page.
To verify the changes, return to the Network Setup page and review the configuration.
Note
If RemoteWisdom was enabled during the initial appliance set up, it was assigned to NIC0. If you choose to reassign RemoteWisdom to another NIC, follow these steps:
Select the NIC from the Select required port for RemoteWisdom drop-down menu. Only configured NICs are listed in this menu.
Optionally, you can specify a gateway for RemoteWisdom. If no Gateway is specified, the gateway of the RemoteWisdom NIC is used.
Note
Network Ports are not available for Kubernetes installations.
Virtana Infrastructure Observability, Virtual Editions
You can deploy one or more OVA(s) for the Virtana Infrastructure Observability Virtual Editions. Once deployed, you can configure NIC0.
You can configure the network settings (IP addresses, DNS servers, and NTP servers) from Virtana Infrastructure Observability, from VMware vCenter.
See the Virtana Infrastructure Observability Virtual Edition Guide for details.
Utilities
 |
The Utilities button allows you to manage the ping and traceroute diagnostic tools.
Using the Ping Utility
Ping functionality is specifically meant to provide feedback to the user on the connection status of NIC0, the port configured with the Initial Configuration Wizard. You can also use ping to check the connectivity of probes, DNS and NTP servers, SMI, switches, LDAP servers, backup destinations, or other data center components.
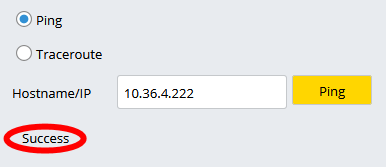
Type in the hostname or IP address that you wish to ping and click Ping.
A Success message indicates a successful ping. An Error dialog box indicates that the ping was not successful.
Using the Traceroute Utility
Traceroute allows you to verify the route (network path) of network packets. The ability to view this route makes it easier to determine where along a network path an error might have occurred.
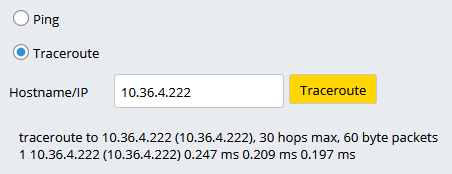
Select the Traceroute option.
Type in the hostname or IP address that you want to trace the route for and click Traceroute.
The route that network packets travel from the Appliance to the hostname or IP address specified are listed.
Using the Network Connectivity Utility
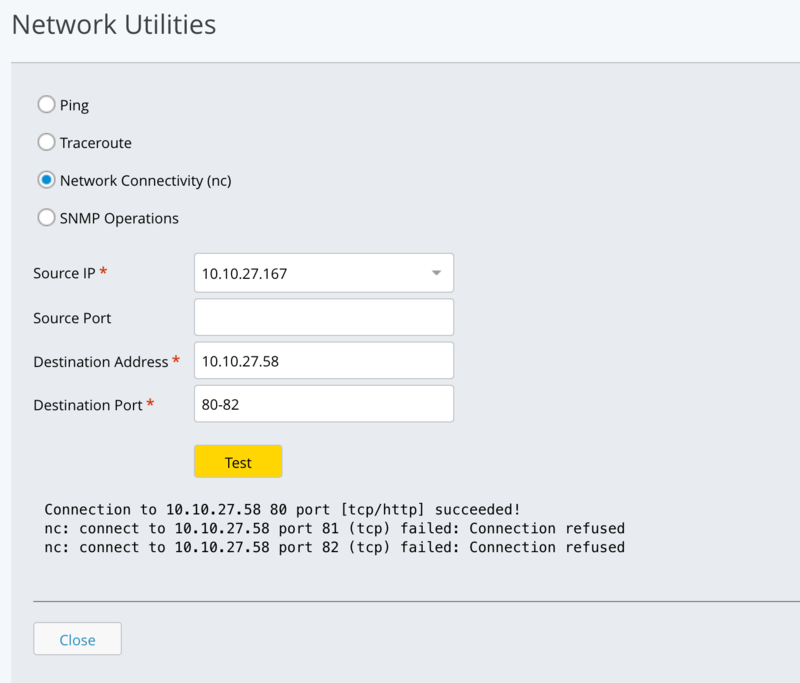
NC tests network connectivity to a specific destination and port. Use NC to confirm that a firewall allows traffic on a required port, or to verify network connectivity to a specific service, such as a probe, DNS server, or backup destination.
Select the Network Connectivity option.
From the Source IP list, select the source IP address to test from.
Optional: In the Source Port field, enter a source port.
In the Destination Address field, enter the address that you want to test.
In the Destination Port field, enter the destination port that you want to test, and click Test. Enter a single port, such as 80, or a range of ports, such as 80-85.
Virtana IO lists a result for each port that you tested.
Connection to 10.10.27.58 80 port [tcp/http] succeeded!
nc: connect to 10.10.27.58 port 81 (tcp) failed: Connection refused
nc: connect to 10.10.27.58 port 82 (tcp) failed: Connection refused
SNMP Operations
Use the SNMP Operations utility in Virtana IO to query a device directly with SNMP Get, SNMP Walk, or SNMP Bulk Walk, without leaving the platform.
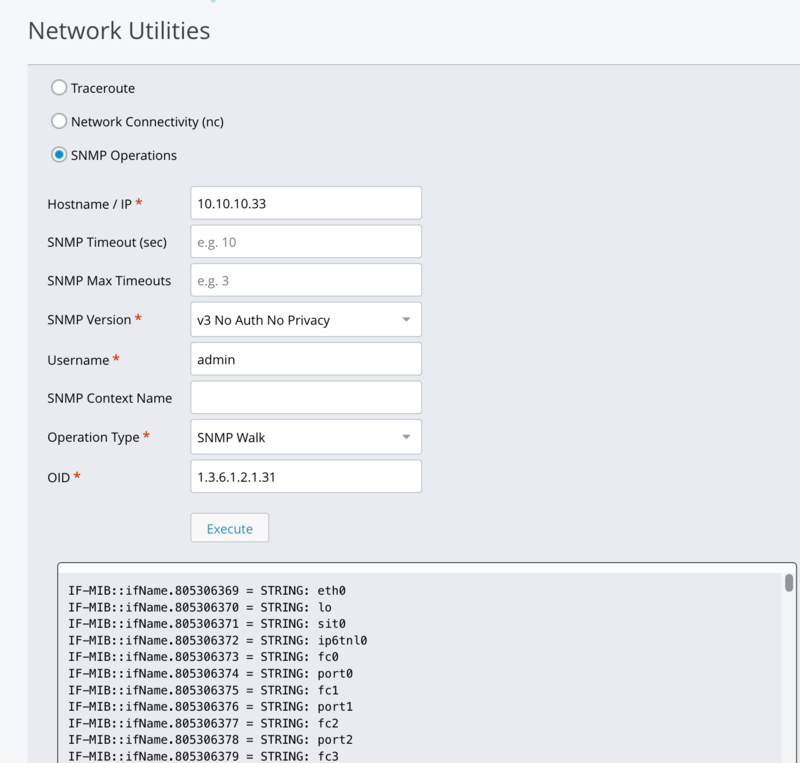
SNMP Operations queries a device with SNMP Get, SNMP Walk, or SNMP Bulk Walk. Use this option to retrieve MIB values from probes, switches, or other data center components that support SNMP.
SNMP Get: Retrieves the value of a specific OID from the device. For example, use SNMP Get to retrieve the CPU utilization for a particular OID.
SNMP Walk: Retrieves multiple OIDs sequentially under a specified OID subtree. Use this operation to discover and collect a set of related metrics, for example to walk the interface OID and retrieve information for all interfaces.
SNMP Bulk Walk: Retrieves multiple OIDs in a single request using SNMP GETBULK. This operation is generally faster and more efficient than SNMP Walk when you collect large amounts of data.
SNMP versions and security levels
The SNMP Version list determines the protocol version and security level that Virtana IO uses to communicate with the device.
v1: Uses the original SNMP protocol version. It provides basic monitoring with limited security.
v2c: An updated SNMP version that supports improved data retrieval and performance. It uses a community string for access control.
v3 Auth Privacy: Uses SNMPv3 with authentication and encryption to secure communication.
v3 Auth No Privacy: Uses SNMPv3 with authentication but no encryption.
v3 No Auth No Privacy: Uses SNMPv3 with no authentication and no encryption.
On the Network Utilities page, select SNMP Operations.
In the Hostname / IP field, enter the hostname or IP address of the device, for example 10.10.10.33.
Optional: In the SNMP Timeout (sec) and SNMP Max Timeouts fields, enter values to override the defaults.
From the SNMP Version list, select the SNMP version the device uses.
In the Community field, enter the SNMP community string for the device.
From the Operation Type list, select SNMP Get, SNMP Walk, or SNMP Bulk Walk.
In the OID field, enter the OID to query, for example 1.3.6.1.2.1.1.1.0.
Click Execute.
The results pane displays the device's response below the form. For an SNMP Walk operation, the pane lists each matching OID with its value,
IF-MIB::ifName.805306369 = STRING: eth0
IF-MIB::ifName.805306370 = STRING: lo
Disk space usage
Run the df -h command in Virtana IO to see how much disk space each filesystem on the appliance is using.
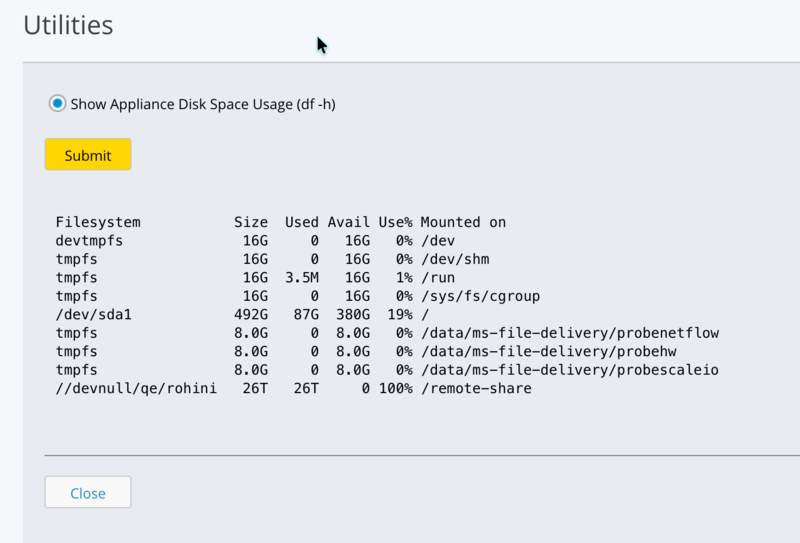
Navigate to Appliance Configuration and click Utilities.
Select Show Appliance Disk Space Usage (df -h).
Click Submit.
Virtana IO displays the output of the df -h command in a table with the following columns: Filesystem, Size, Used, Avail, Use%, and Mounted on. Each row lists one filesystem on the appliance.