NetFlow Integration
 |
The NetFlow Integration captures flow records from NetFlow, sFlow, Jflow, and IPFIX and sends them to the IO appliance.
Use IO to control bandwidth utilization, optimize application performance, and troubleshoot problems. Typical use cases include:
What bandwidth is being consumed by a particular IP node?
Who/What is congesting the network? Or, what is the bandwidth usage of specific applications?
Who is talking to whom?
Who is using a particular network service?
What are the top talkers in a subnet?
Which network services are being used?
Detects network anomalies (DDoS, SPAM, BotNets, abnormal downloads/uploads, …)
Detects impact of hosts on other hosts and correlates to affected applications and storage, via contention analysis
Predict, prevent, and remediate performance problems via correlation with other data sources, such as the Dell EMC PowerFlex Integration and NetApp integrations, combined with analytic
An IP flow record provides a summary of the interaction between two IP addresses. The application discovery process uses Network Conversations to find/suggest possible applications, and uses a likely-kind heuristic analysis to determine possible roles of network endpoints. It provides information to determine:
How much bandwidth is consumed by a specific IP?
Who is a network hog?
Who is talking to whom?
Who is using a specific network service?
Who are the top talkers in a subnet?
Which network services are being used?
Duplicate flows, from redundant sources, can misrepresent the actual amount of traffic reported. Flow deduplication:
Identifies possible home links for subnets and IPs, collecting information from subscribed routers about their subnets and interfaces, and from vCenter about the virtual distributed switches, their ports and associated IP addresses.
Monitors live traffic to identify active home links for both source and destination IPs
Requires a warm-up period to identify active home links.
Accepts or filters flows based on active home link information
Reports errors if conflicts are detected (for example, two different routers with the same active home link subnets).
IO Health Notifications are generated, the feature is disabled, and an error is shown on the Probes and Integrations page when:
Errors prevent the feature from being enabled
The proxy detects an issue
SNMP credentials are incorrect
Router inaccessible (direct connectivity between router and IO is required)
VDS does not have associated vCenter configured in VMware vSphere Integration
Conflicting home link information
When issue detected
Health alert generated
Feature automatically disabled
Error shown in Probes and Integrations page
Correct the problem and re-enable feature.
Caveats:
Feature works only when network topology is relatively static. The network being monitored does not use dynamic routing.
VDS must be associated with a vCenter already configured in IO
VDS updates linked to VMware vSphere Integration scheduled discovery (not discovery updates)
Data collected from Level 2 switches is necessarily limited because switch data is routed via MAC address rather than IP address
Deduplication caveats
Recommend configuring VMware vSphere Integration before enabling duplication detection
Deduplication is all or nothing: All VDS and all router source types must be properly configured in NetFlow and vCenter or deduplication fails
The source type (router or VDS) must be correctly set and subscribed in IO
Each subscribed "Router" type flow source must have router SNMP configured; each subscribed "VDS" type flow source must be configured in vCenter
The IP addresses in NetFlow and vCenter for VDS must match. If not, the VDS shows up as “not found” under the VDS vCenter column in the NetFlow integration and deduplication fails
Sampling rate determination:
Global Sampling Rate should be set as low as possible, as long as flow data can still be processed in a timely manner.
If the rate is set too low, flow processing might not be able to keep up, too high a load might be generated on the box, and some data might get dropped. Increase the rate, and NetFlow Integration looks for indications that the flow processor is struggling to keep up. If detected, a health alert is generated, recommending a specific global sampling rate increase.
If the rate is set too high, sampling requires NetFlow Integration to fill in the gaps, and accuracy might suffer. Decrease the rate, and NetFlow Integration tracks incoming flow rates versus expected flow processing capacity. If the Global Sampling Rate can be safely lowered, a health alert is generated, recommending a specific global sampling rate decrease.
You can create a Network Usage Rate alarm rule with specific thresholds described by:
Incoming and/or Outgoing traffic
Bitrate or Packetrate
The rule applies to entity types with NetFlow metrics, and the case shows trend chart of specified metrics and corresponding thresholds.
Click Settings, then Integrations in the Probes and Integrations section, and then the View button for NetFlow Integration.
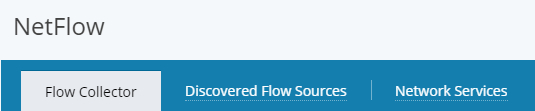
The NetFlow Integration page is displayed, consists of three tabs:
Flow Collector
Discovered Flow Sources
Network Services
Flow Collector
This tab specifies the IP address and port number, scheduled discovery, and limits the scope of flow source discovery.
 |
Specify an Interface (IP address) and Port number.
Flow source discovery time/frequency are enabled by default.
To specify in the Discovering Entities area which subnets to Monitor and Not Monitor, click Add to enter the IP address and mask for each subnet.
In the Entity Discovery Thresholds section, enter the minimum numbers of Packets/Second and Bits/Second for Network Conversations entity discovery.
Click Save and then Start Discovery.
You can click Save at any time to save the current status of the operation.
Select individual or multiple subnets and click Subscribe/Unsubscribe.
Discovered Flow Sources
This tab subscribes to flow sources to discover IP Addresses, Network Services, and Network Conversations. If the Sampling Rate is not displayed, specify a rate based on the flow source configuration. The default global sampling rate is 1.
Select one or more source IP addresses.
To Detect Duplicate Flows, click the checkbox (off by default).
Duplicate flows, from redundant sources, can misrepresent the actual amount of traffic reported. Deduplication requires SNMP access to all subscribed routers, and all subscribed vDSs must be linked to a vCenter via the vCenter Integration.
You can click Save at any time to save the current status of the operation.
Click Save and then Start Discovery.
You can click Save at any time to save the current status of the operation.
Select individual, multiple, or all source IP addresses and click Subscribe/Unsubscribe.
Network Services
This tab lists network services.
Click Add to add a network service.
Add Network Service displays.
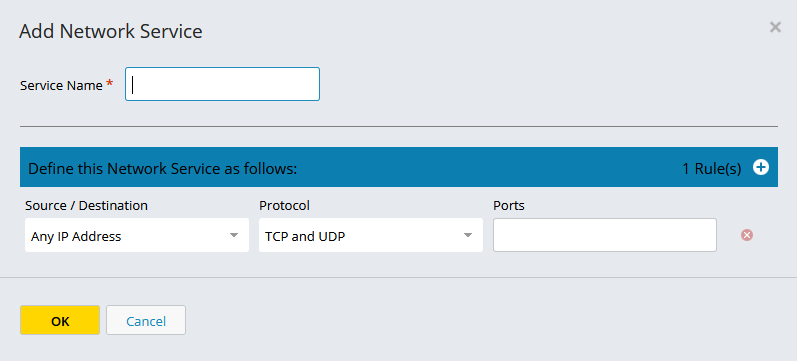
Specify Service Name, Source/Destination, Protocol, and Ports.
Click OK.
Click the + to create additional rules, specify the new information, and click OK.
Click Save and then Start Discovery.
You can click Save at any time to save the current status of the operation.
Select individual, multiple, or all network services and click Subscribe/Unsubscribe.