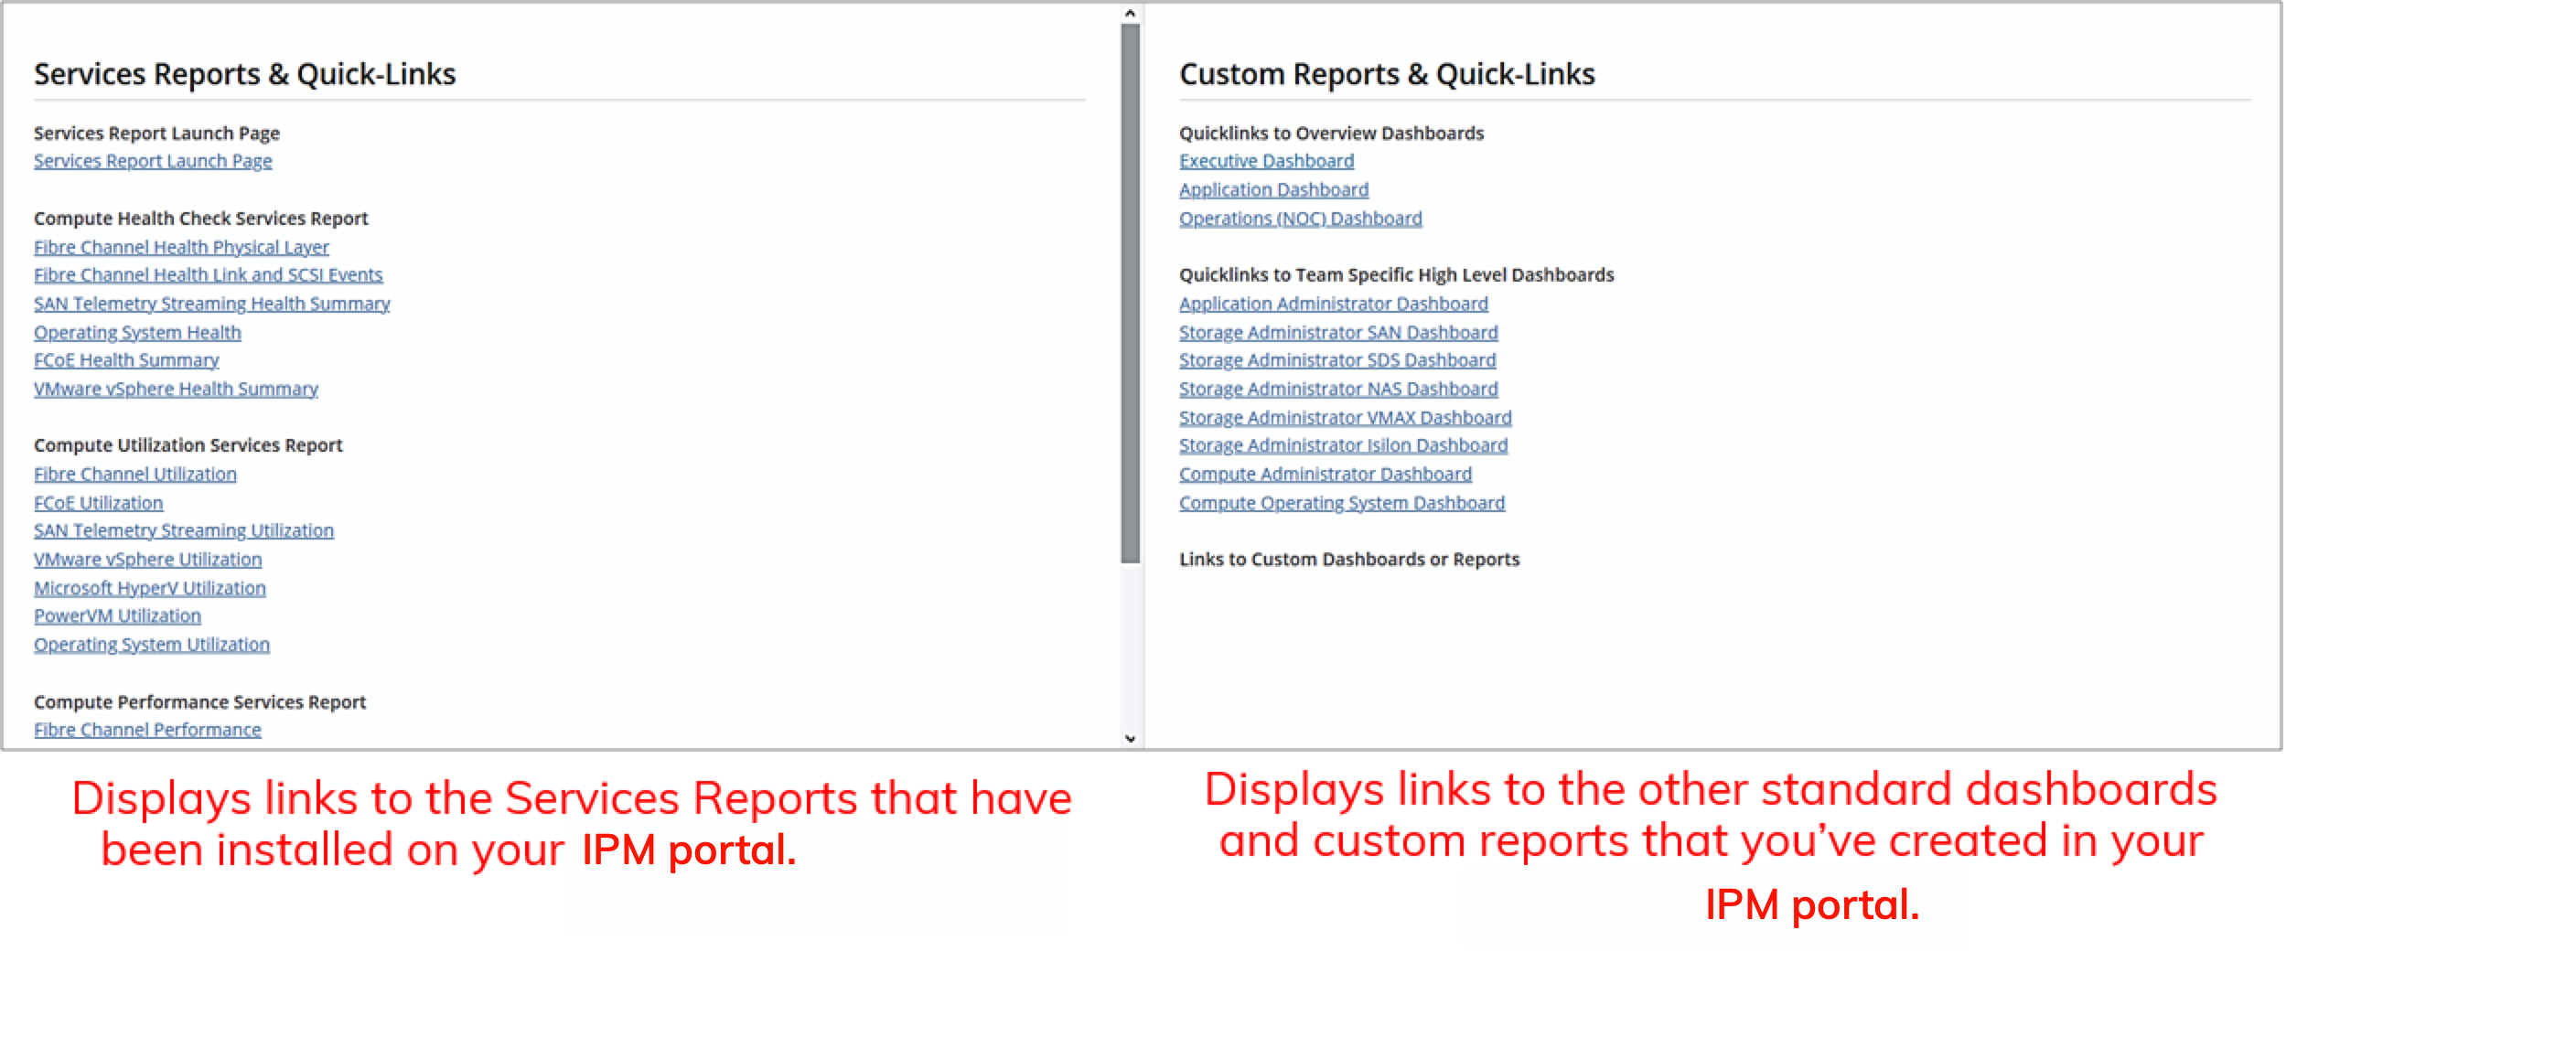
Operations (NOC) Dashboard
The Operations (NOC) Dashboard presents health data for applications, and compute, network, and storage infrastructure.
The dashboard is available for FC SAN, VMware vSphere, Microsoft Hyper-V, IBM PowerVM, Host OS, PowerMax, Isilon, vSAN, and PowerFlex integrations.
Report Variables
You can filter the report for an application, ESX host, host,storage array, PowerMax storage array, Isilon cluster, or OS Instance. Use the filters to drill down on a specified infrastructure component.

Report Sections
The report is divided into eight sections:
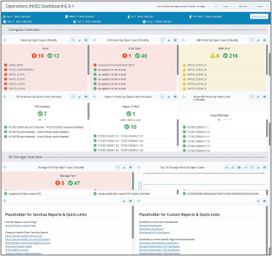
Application Overview
Use the Application Overview section to quickly observe where problems exist in the infrastructure supporting the applications. View open cases to use the investigations to troubleshoot and remediate issues. Note applications with issues to use to filter the report.
Compute Overview
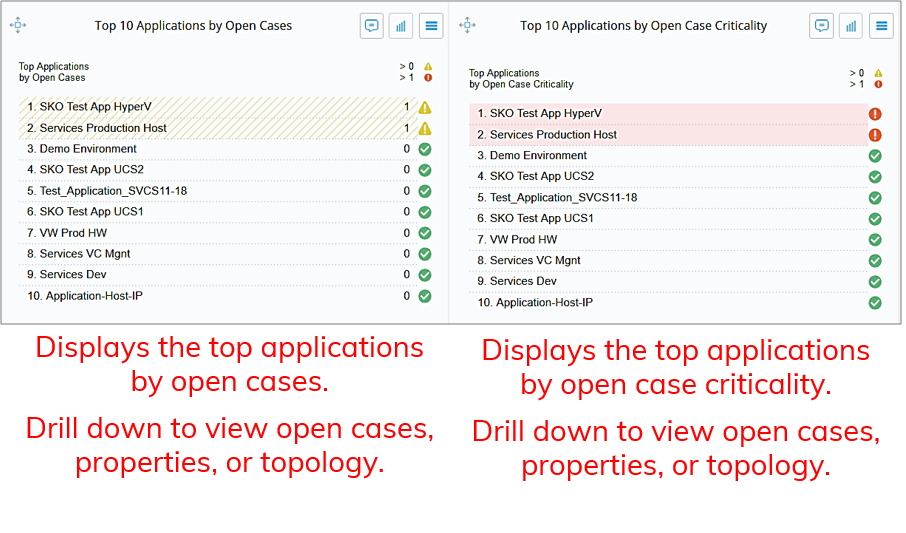
Use the Compute Overview section to quickly observe where problems exist in the Compute infrastructure. View open cases to use the investigations to troubleshoot and remediate issues.
This section is filtered by host, ESX host, and OS instance and shows you open case data for hosts, ESX hosts, Hyper-V hosts, PowerVM hosts, OS instances, and HBA ports.
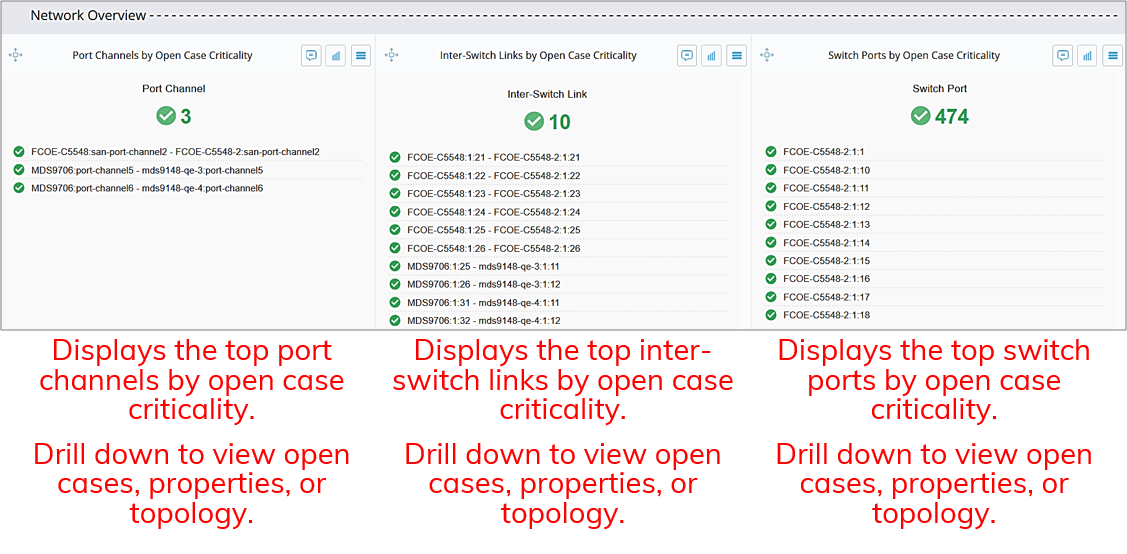
Network Overview
Use the Network Overview section to quickly observe where problems exist in the Network infrastructure. View open cases to use the investigations to troubleshoot and remediate issues.
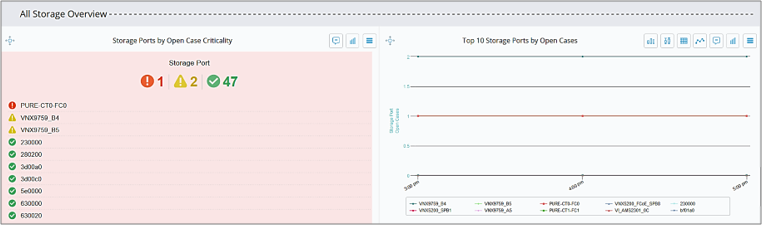
All Storage
Use the All Storage Overview section to quickly observe where problems exist in the Storage infrastructure. View open cases to use the investigations to troubleshoot and remediate issues.
This section is filtered by storage array and shows you open case data for storage ports.
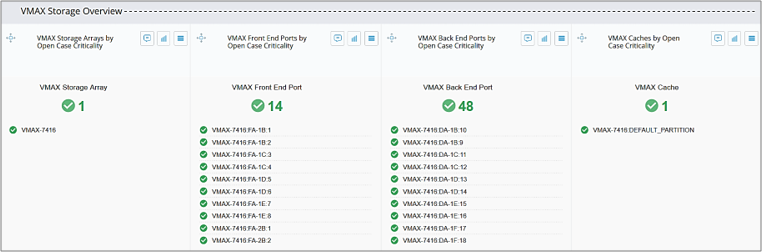
PowerMax Storage Overview
Use the PowerMax Storage Overview section to quickly observe where problems exist in the PowerMax Storage infrastructure. View open cases to use the investigations to troubleshoot and remediate issues.
This section is filtered by PowerMax storage array and shows you open case data for PowerMax storage arrays, PowerMax front end and back end ports, and PowerMax caches.
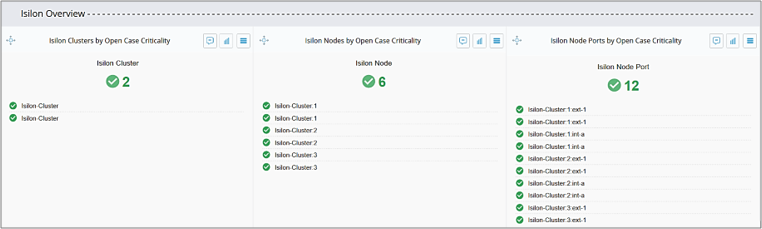
Isilon Storage Overview
Use the Isilon Storage Overview section to quickly observe where problems exist in the Isilon Storage infrastructure. View open cases to use the investigations to troubleshoot and remediate issues.
This section is filtered by Isilon Cluster and shows you open case data for Isilon Clusters, Nodes, and Node Ports.
SDS Storage Overview
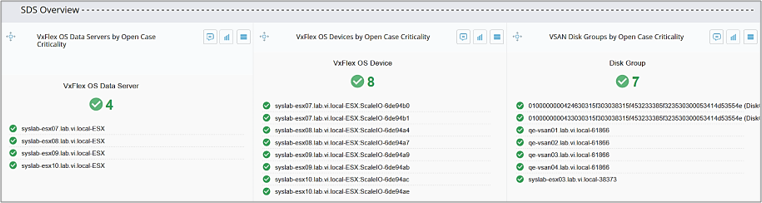
Use the SDS Storage Overview section to quickly observe where problems exist in the vSAN or PowerFlex storage infrastructure. View open cases to use the investigations to troubleshoot and remediate issues.
This section shows you open case data for PowerFlex Data Servers and Devices, and vSAN Disk Groups.
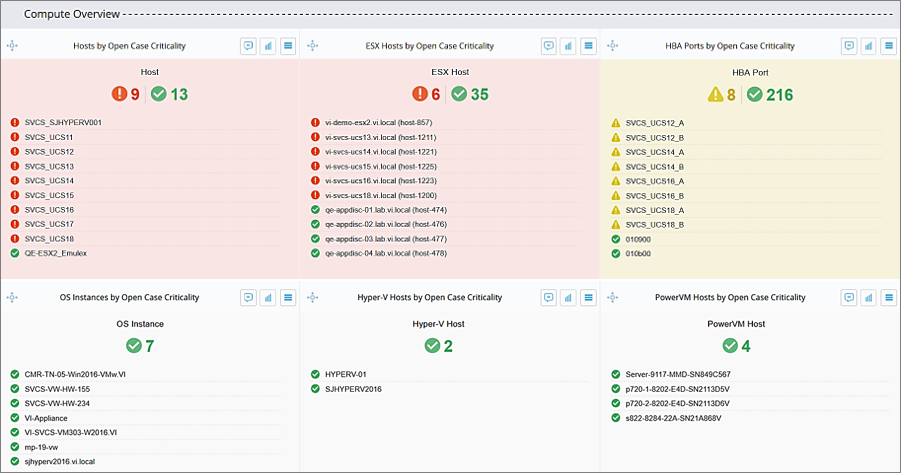
Report Quick Links
Use this section to view additional reports and dashboards.