Architecture
Container Observability provides intelligent observability by ingesting data across the application, Kubernetes orchestration, and infrastructure layers. It achieves this through lightweight gateway pods deployed within the Kubernetes cluster, enabling seamless integration with existing monitoring and configuration environments. Container Observability collects a wide range of telemetry data from open-source tools and cloud infrastructure for real-time analysis, while allowing those original tools and platforms to remain the long-term storage sources for historical data. This approach ensures deep insights without disrupting existing observability pipelines.
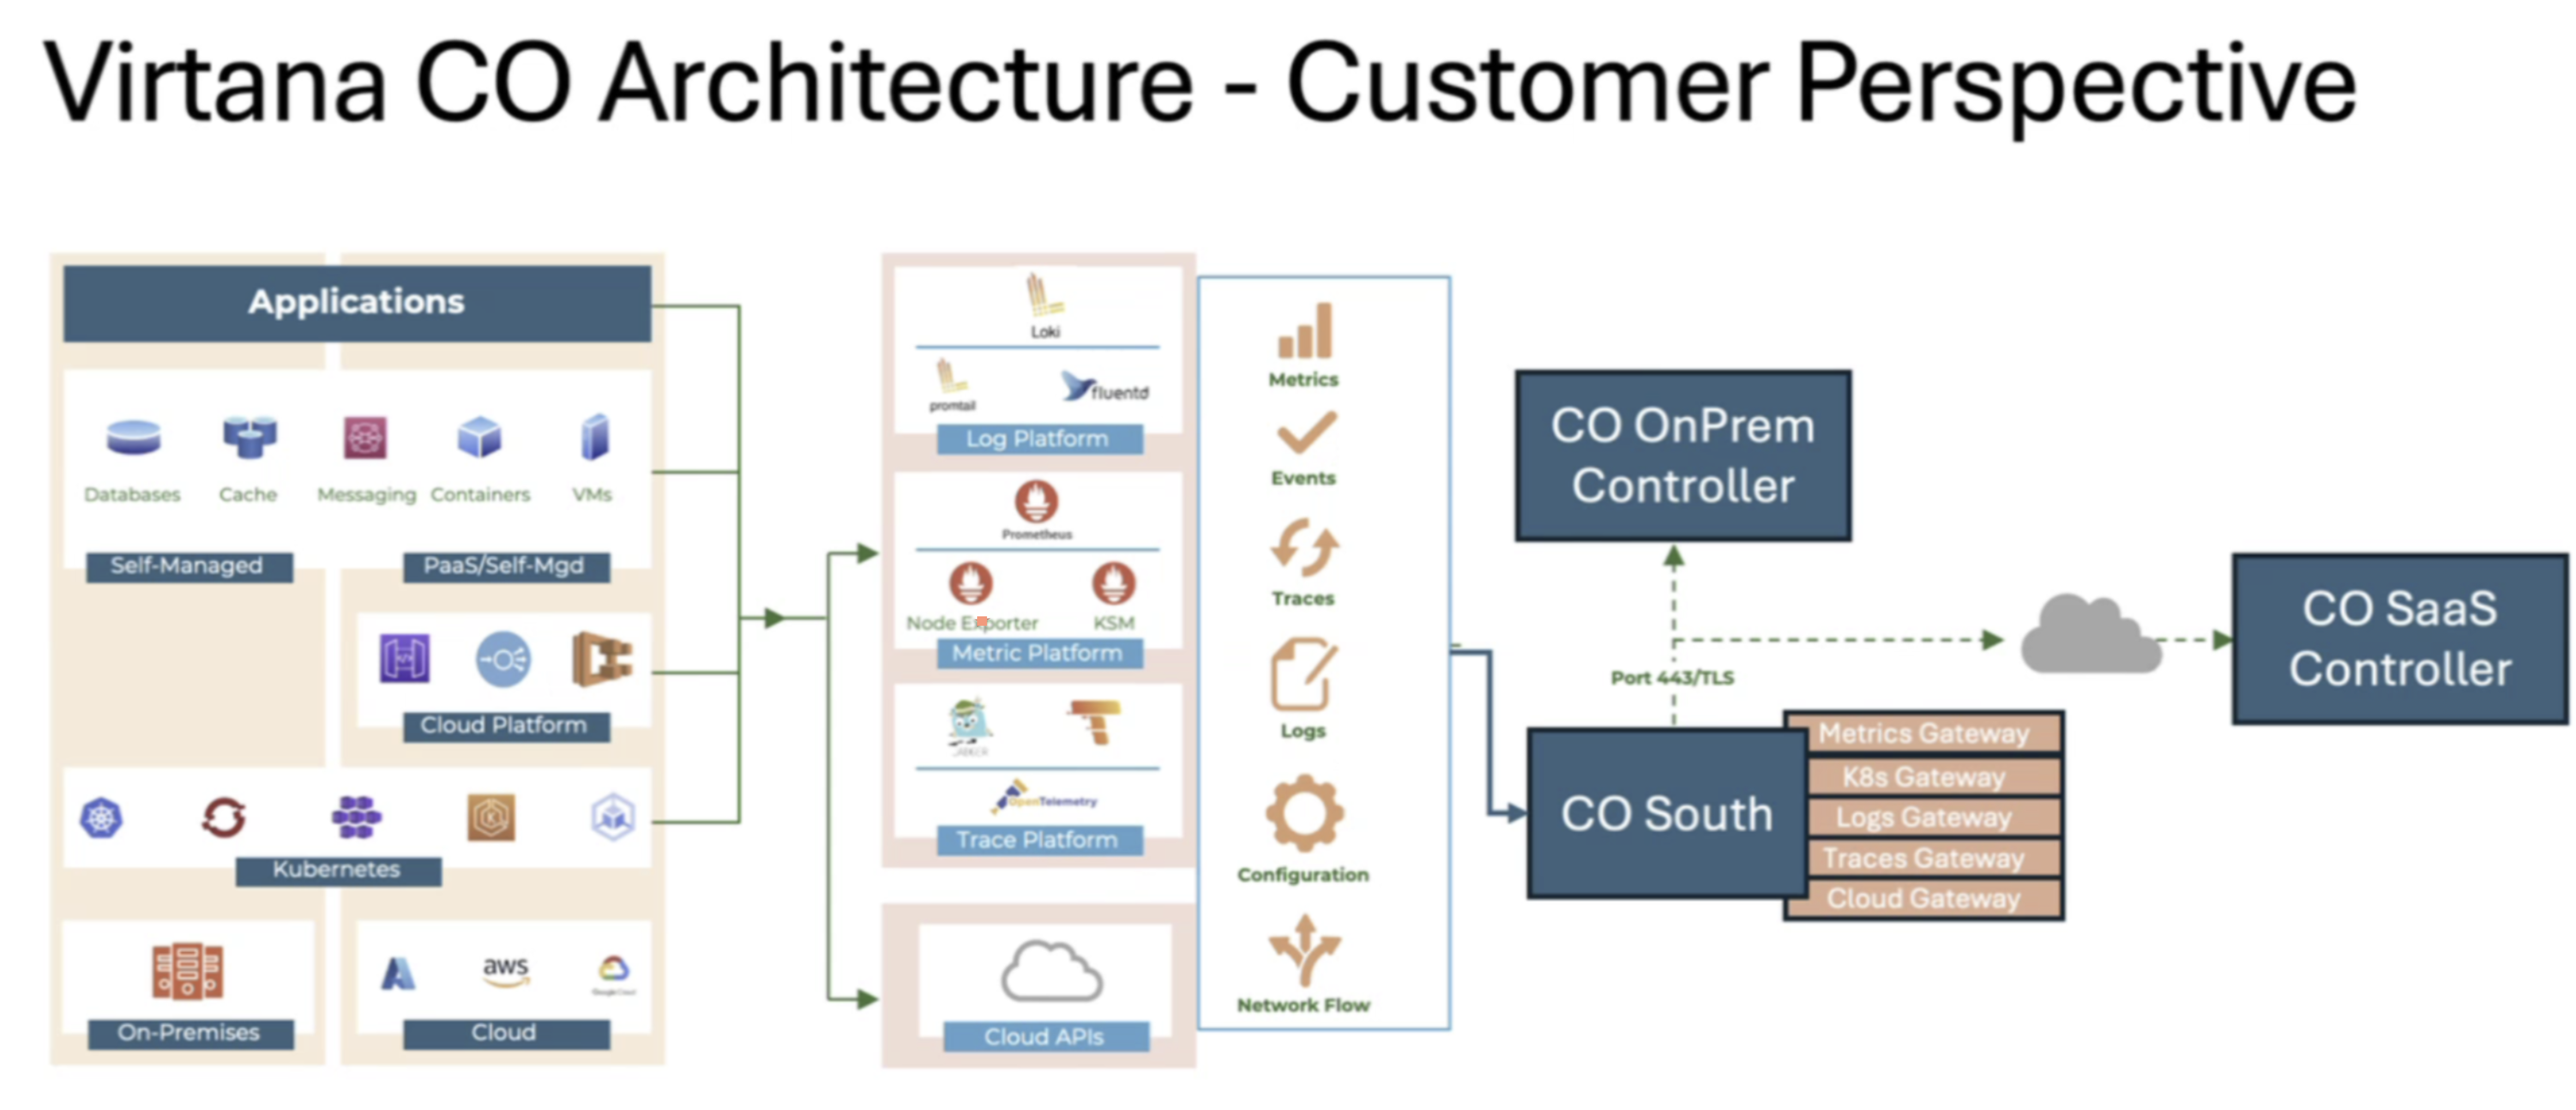
Key aspects of the architecture:
Simple Deployment: Easily installable using Kubernetes-native tools like Helm, enabling quick onboarding.
Non-Intrusive: Does not affect application workloads or worker node performance.
No Code Changes Required: Operates without modifying application code or introducing sidecars.
Secure API Access: All access to Kubernetes APIs and cloud accounts is initiated from within the user’s environment.
Credential Safety: Credentials stay within the Kubernetes cluster and are never sent to Container Observability SaaS servers.
Privacy-Conscious: No Personally Identifiable Information (PII) or Protected Health Information (PHI) is transmitted—only operational system-level telemetry is collected.
Data Ownership and Cost Efficiency: You retain full control over your telemetry data (metrics, logs, traces), enabling cost-effective storage and integration with other tools or business processes.
Data Flow and Communication
Gateway pods interact with Kubernetes, cloud environments, and telemetry sources (metrics and logs) to collect operational data. This data is securely compressed and transmitted via outbound SSL/TLS connections to the Container Observability SaaS backend. Users can access the Container Observability interface through any standard web browser. Container Observability generates highly enriched alerts based on contextual analysis and can forward them to common incident management and communication tools such as email, PagerDuty, Slack, and ServiceNow.
Core Components
Container Observability is designed to integrate seamlessly with modern cloud-native environments by leveraging popular CNCF (Cloud Native Computing Foundation) tools for telemetry collection. Rather than relying on proprietary agents, Container Observability uses lightweight integrations to ensure minimal system overhead and maximum observability.
Container Observability is designed to integrate seamlessly with modern cloud-native environments by leveraging popular CNCF (Cloud Native Computing Foundation) tools for telemetry collection. Rather than relying on proprietary agents, Container Observability uses lightweight integrations to ensure minimal system overhead and maximum observability.
OpenTelemetry Collector/ Prometheus – for metrics
Loki or Splunk – for logs
Jaeger – for distributed traces
Kubernetes API – for configuration and state information
eBPF, Beyla and Conntrack – for flow and network-level insights
Key Benefits and Capabilities
Unified Telemetry Ingestion: Container Observability embeds and supports leading open-source telemetry sources, offering end-to-end visibility without vendor lock-in.
Full-Stack Dependency Discovery: Automatically maps service-to-service and service-to-infrastructure relationships
Contextual K8s Map View: Presents a single, unified UI for monitoring Kubernetes clusters, providing deep insights into application behavior.
Predictive Anomaly Detection: Uses contextual machine learning to identify abnormal patterns before they cause disruptions.
Automated Root Cause Analysis: Pinpoints the source of performance issues or failures without requiring manual intervention.