License Usage Reports
You can generate a report of the Virtana Platform licenses you have purchased and are using. You can view interactive charts and tables for the selected module and time range or download the data to an .xlsx file for offline analysis and sharing.
Reports are generated per module, by selecting either Cloud Cost Management (CCM) or IO. Only one report can be generated at a time. To access the license usage reports, see View License Usage Reports.
 |
If you generate a report for the same module and the same time range, the new report replaces any existing report that uses the same parameters.
Reseller and MSP partners can run reports that include information about their own licenses and the licenses and license consumption of their customers.
License Usage Reports for MSPs and Resellers
A user in a child sub-org, who is assigned an administrator role, can run a license report showing the consumption of licenses by their child sub-org. However, a user for the sub-org cannot see the parent organization’s license quantity in the report, even if they are sharing the parent's license.
An administrator for a parent organization can run a license usage report for the parent organization as well as any child sub-orgs. If a child sub-org is consuming the parent's license, then that child sub-org's consumption against that license is shown.
Tracking license usage in Virtana Platform
Virtana Cloud Cost Management and IO are billed based on running devices. A running device is defined as a VM.
Tracking license usage in Virtana CCM
Cloud Cost Management (CCM) is billed based on the average number of running devices (VMs) configured during a month. This is a simple average of all VMs that exist on each day of a given month.
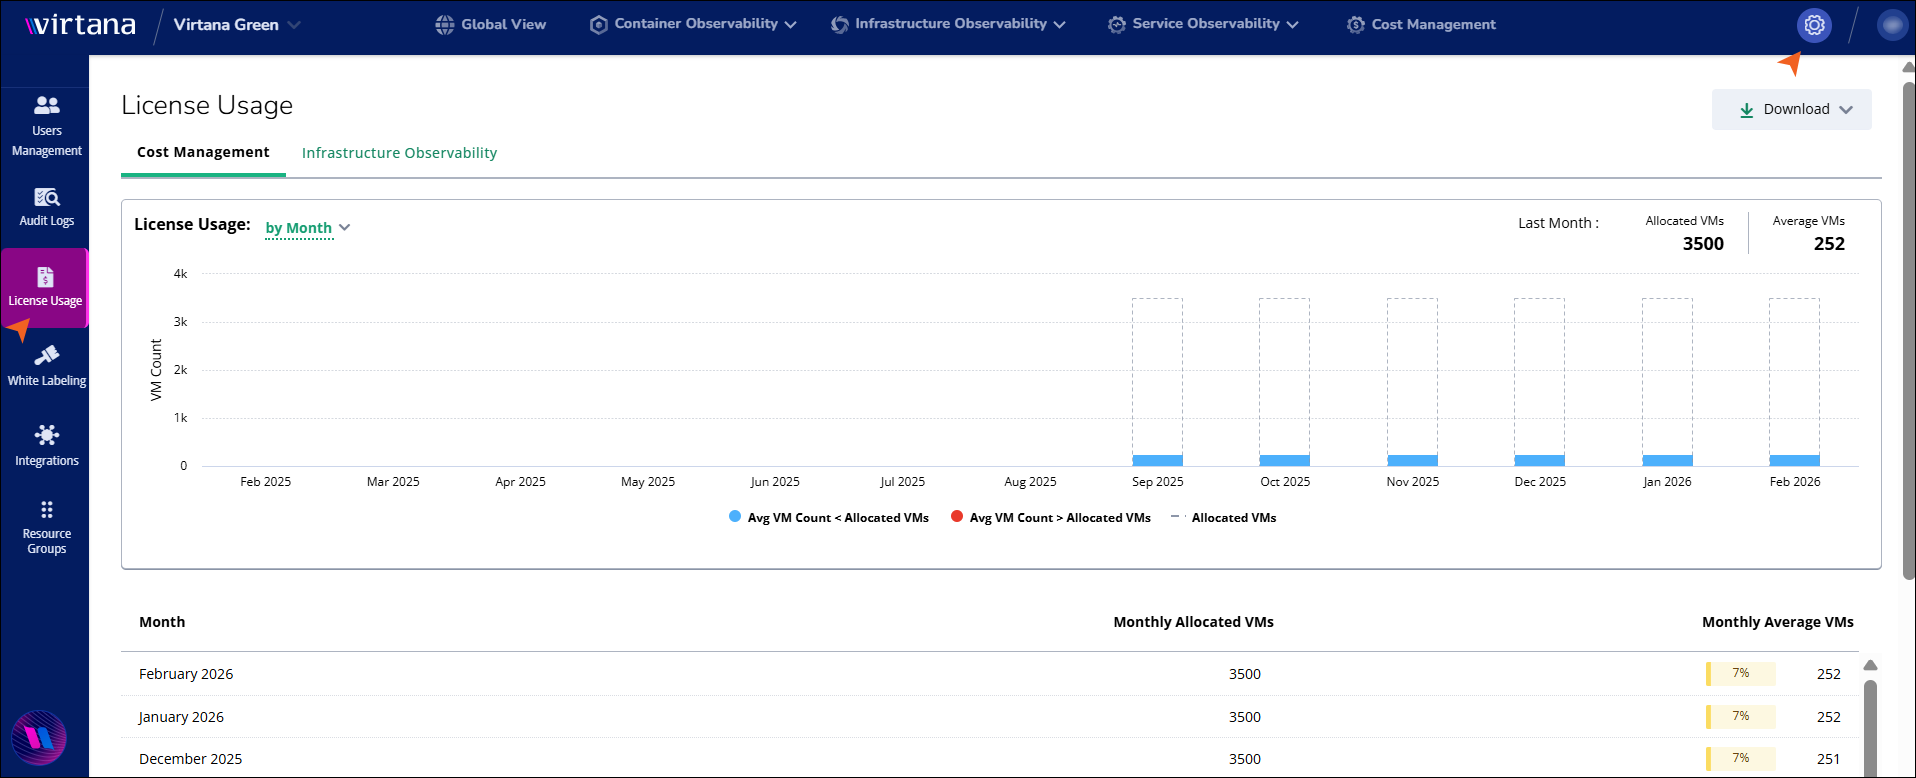
The license usage chart displays VM license consumption aggregated by month over the selected period.
License Usage: Drop‑down that lets you choose the aggregation for the chart by Month/Day.
Allocated VMs: Column bars without any color shows total licensed VM capacity for each month.
Avg VM count less than allocated VMs: Blue bars that show the average VM count for months where usage is below the allocated capacity.
Avg VM count more than allocated VMs: Red bars that show the average VM count for months where usage exceeds the allocated capacity.
Hover over a bar to see the exact values for that month.
The table provides the same information in tabular form.
Column name | Description |
|---|---|
Month | Calendar month for the usage values. |
Monthly Allocated VMs | Licensed VM capacity for that month. |
Monthly Average VMs | Measured the average VM count for that month. Includes a percentage bar showing how much of the allocated capacity is utilized. |
Tracking license usage in Virtana Infrastructure Observability
When you select Infrastructure Observability, the License Usage page shows license consumption for the infrastructure metrics that are licensed in your environment.
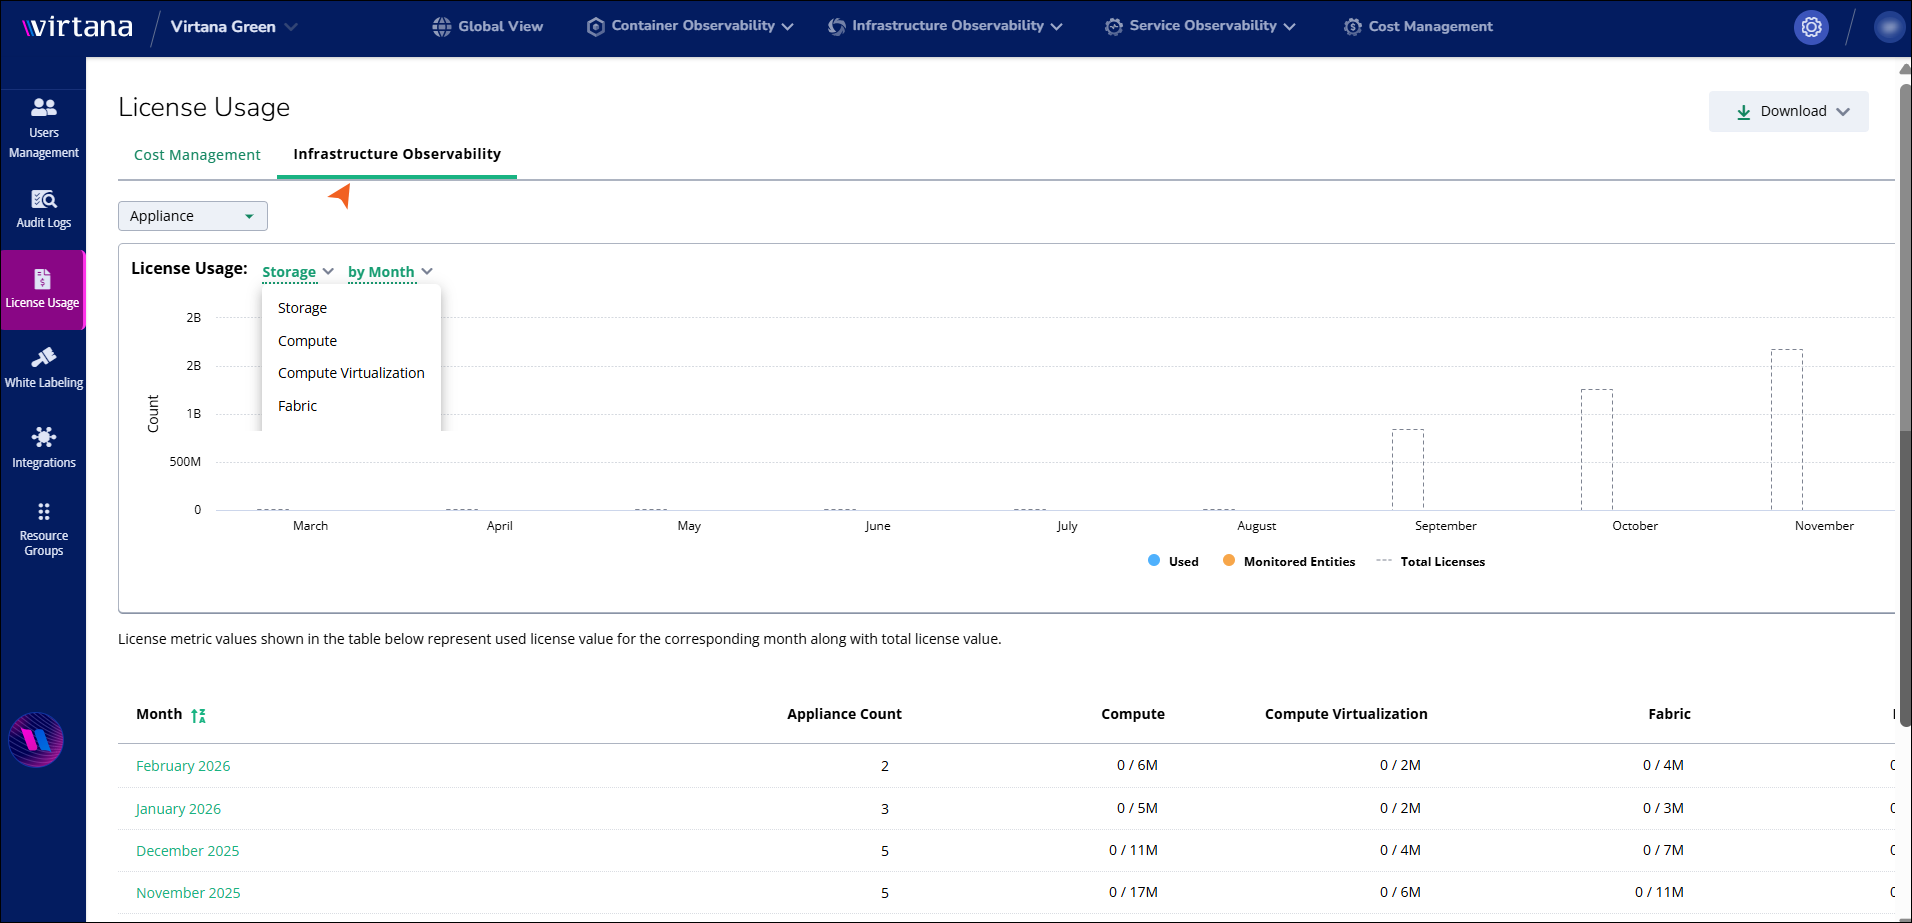
If you have more than one appliance, use the Appliance drop‑down to choose the appliance whose license usage you want to view. The charts and tables update to reflect the selected appliance.
The License Usage chart provides a monthly view of license consumption for a specific infrastructure metric.
License Usage: Drop‑down that lets you choose the metric, such as Storage, Compute, Compute virtualization, Fabric, Network flows, Storage conversation, and aggregation for the chart by Month/Day.
Used: Blue bars that show license usage for the selected metric and month. For example, if you use one license for every five VMs, then five monitored VMs would result in one used license.
Monitored Entities: Orange bars show the number of underlying monitored items contributing to license consumption.
Total Licenses: Column bars without any color indicate total licensed capacity for the selected metric.
Hover over a month to see the Used, Monitored Entities, and Total Licenses values for that point in time.
The table below the chart shows monthly license metrics for the selected appliance.
Column name | Description |
|---|---|
Month | Calendar month for the usage values. |
Appliance Count | Number of appliances contributing to license usage for that month. |
Compute | Usage is monitored for physical compute resources, such as servers or hosts. |
Compute Virtualization | Virtualized compute resources, such as VMs and hypervisors, are monitored. |
Fabric | Licensed usage for monitored SAN or fabric infrastructure, such as switches and ports. |
Network | Network traffic and devices, such as routers, switches, and links, are monitored. |
Storage | Usage of storage capacity and performance across arrays and volumes is monitored. |
Storage Conversation | End‑to‑end storage conversations between hosts, networks, and storage are monitored for used licenses. |
When you click on a particular month inside the table, the side panel opens. In this panel, you can select an appliance to view its corresponding data. It provides a Wisdom Pack breakdown feature, which displays license consumption by each Wisdom Pack. You can also download the monthly data as an .xlsx file using the download option. Additionally, you can choose the specific month for which you want to display usage information.
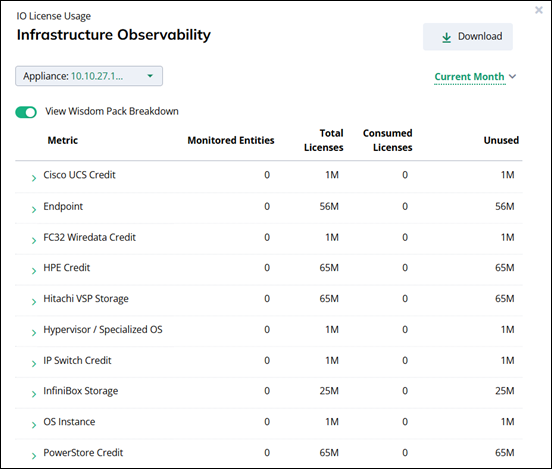
The table shows the following details:
Column name | Description |
|---|---|
Metric | Wisdom Pack or credit type |
Monitored Entities | Number of monitored entities using that Wisdom Pack. |
Total Licenses | Licensed capacity for that Wisdom Pack. |
Consumed Licenses | Capacity used in the selected month. |
Unused | Remaining license capacity for that month. |