Inventory
Inventory is your "one-stop shop" for viewing and managing entities
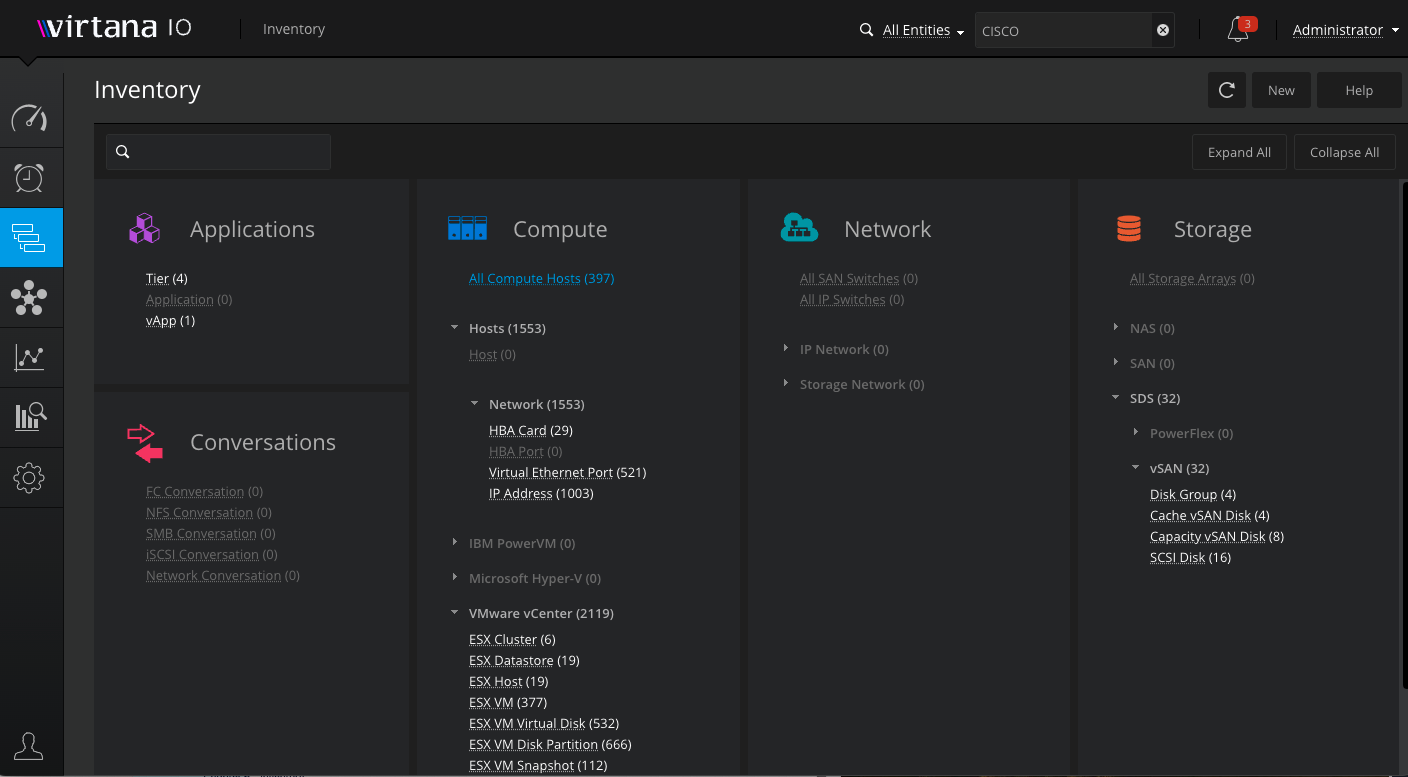
After IO has discovered your entities, they are visible throughout the IO user interface. The Inventory module provides a single location for viewing all of your IO entities.
Entities are organized into five categories: Applications, Conversations, Compute, Network, and Storage.
Use the search box to search for an entity using its name.
You can use the expand/collapse all buttons to expand or collapse the categories for easier view. Click on the arrow next to a category to expand it.
Note
Counts on the Inventory landing page are cached and updated every five minutes. You can click the refresh icon on the Inventory landing page to update the counts.
All Compute Hosts
In order to view all the Hosts in a Single view, a new entity category called "All Compute Hosts" has been added under "Compute" category of "Inventory" as shown below
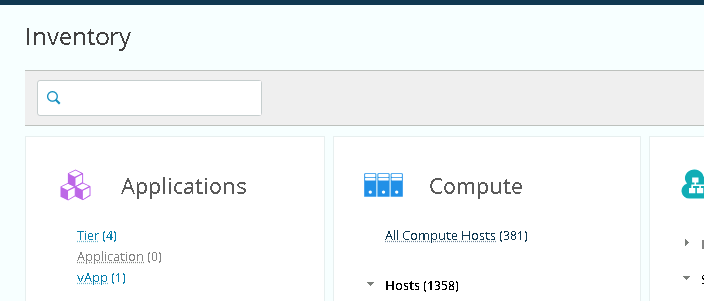
The total count of Hosts is displayed in the parentheses.
The following Host types are displayed in this list: ESX, HyperV, KVM, Windows, Linux, and Solaris and User Defined Hosts
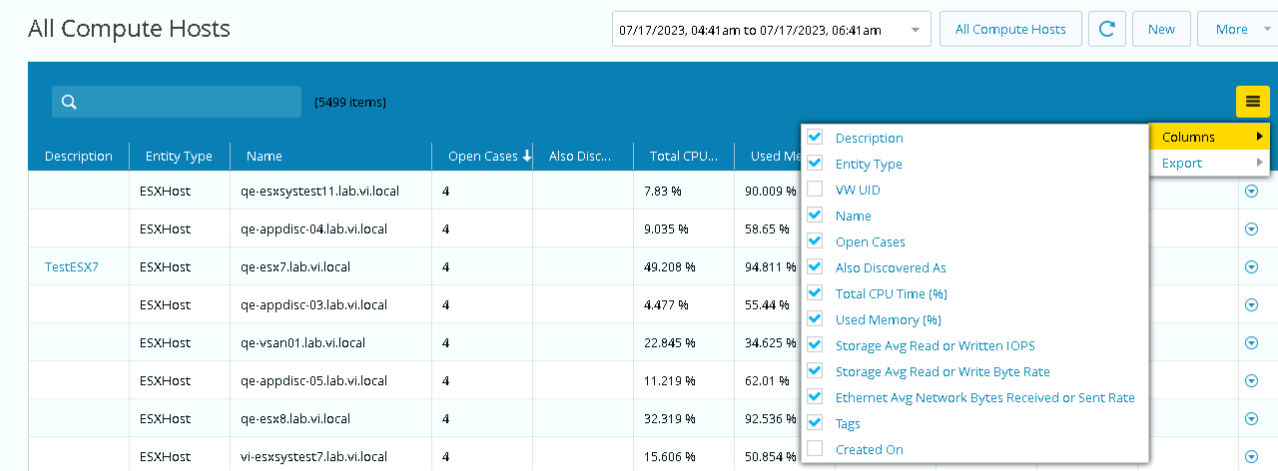
In the list, the following columns are available for selection :
Description
Entity Type
IO UID
Name
Open Cases
Also Discovered As
Total CPU Time (%)
Used Memory (%)
Storage Avg Read or Written IOPS
Storage Avg Read or Write Byte Rate
Ethernet Avg Network Bytes Received or Sent Rate
Tags
Created On
Note
"Open Cases" & "Also Discovered As" columns are not shown by default. Users can select/unselect the columns by clicking on the hamburger icon &; then clicking on "Columns" option.
Note
User can Sort any of the columns except for "Also Discovered As" column.
"Search" can be performed on "Name" & "Tags" columns as shown below. The list can be exported to the clipboard or as a .csv file

All SAN Switches & All IP Switches
In order to provide ability to view all "SAN Switches" and "IP Switches" in a Single view, new entity category called "All SAN Switches" and "All IP Switches" has been added under "Network" category of "Inventory" as shown below
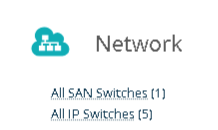
Count of total SAN Switches and IP Swithces is displayed in the bracket.
For "All SAN Switches" in the list following columns are available for selection
Description
Entity Type
IO UID
IP Address
Name
Open Cases
Manufacturer
Model
Serial Number
Version
Tags
Created On
image : allsanswitches
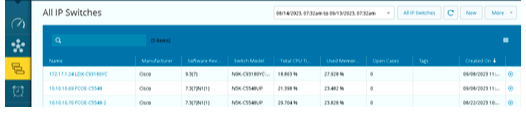
For "All IP Switches" in the list following columns are available for selection
Description
Entity Type
IO UID
Name
Manufacturer
Software Revision
Switch Model
Total CPU Time (%)
Used Memory (%)
Open Cases
Tags
Created On
User can export the list to clipboard or as .csv
All Storage Switches
In order to provide ability to view all Storage Arrays in a Single view, a new entity type called "All Storage Arrays" has been added under "Storage" category of "Inventory" as shown below
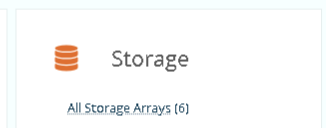
Count of total Storage Arrays is displayed in the bracket.
In the list following columns are available to select
Description
Entity Type
IO UID
Name
Model
Manufacturer
Firmware Version
Storage Avg Read or Written IOPS
Storage Avg Read or Write Byte Rate
Storage Avg Latency per Read or Write Operations
Avg % Utilized Capacity
Avg % Free Capacity
Provisioned Capacity
Compression Efficiency
Open Cases
Tags
Created On
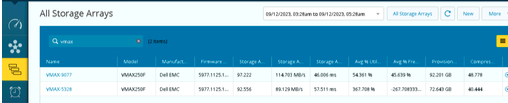
User can export the list to clipboard or as .csv
Clickable Metric Popup Window
User can select a Metric value and click on it which would open a separate popup window and that will show the graph with the associated value as follows
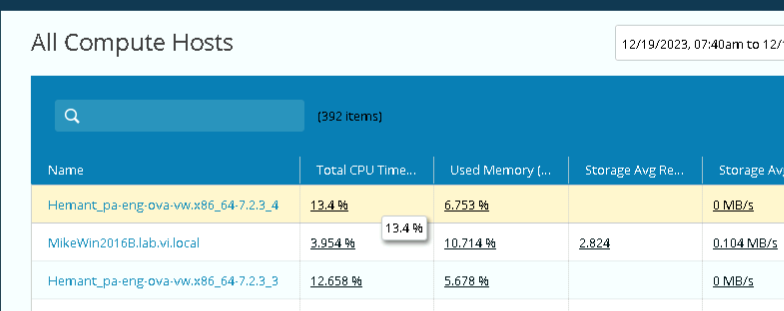
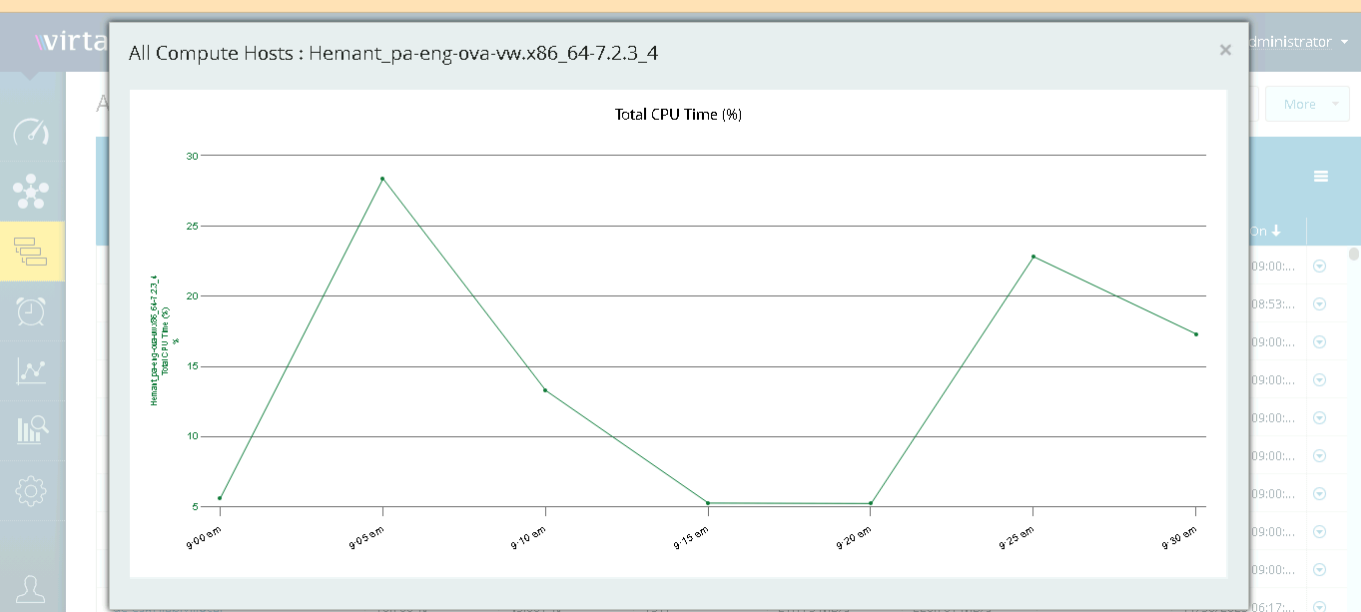
Clickable Metrics Popup Window is available for below
1. Inventory -> Summary Views viz. All Compute Hosts, All SAN Switches, All IP Switches, All Storage Arrays
2. Overview Tab -> Metadata -> Property view
3. TopN Chart -> List Card