About Inventory
On the Inventory page, you can browse, query, and investigate entities that are currently in your Virtana Service Observability environment.
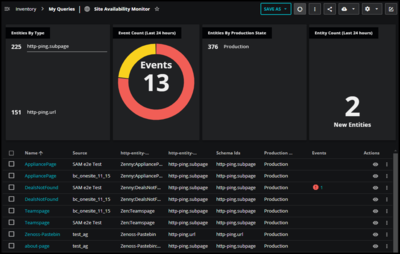
Because you may have a very large number of entities in your system, the ability to both query and filter your inventory is important to locate and examine specific entities that are critical to your workflows.
Inventory queries consist of one or more entity property-value comparisons. You can view query results in a table with one row per entity and one column for each property. When you create a query that provides rich results, you can save those queries and share them with your team.
Entity properties vary widely by source, so the default table can include many columns. You can narrow down these results using the query bar.
For more information about entities, see Entities and devices.
Note
If you created organizers for your devices in Collection Zone (CZ), you can view them in Inventory. The Organizers view in Inventory provides a Cloud-based alternative to the Infrastructure page in Collection Zone (CZ), to help you transition your workflows more seamlessly to Virtana Service Observability. To learn more, see Organizers tab.
Opening the Inventory page
You can query and examine your inventory of entities from the following locations:
The Virtana Service Observability header is visible on all tabs. In the header, click INVENTORY.
Note
Your account must be assigned the Read Only User role or a more privileged role to see the INVENTORY tab, run or create queries, and display entity tables.
Tour of the Inventory page
When you click the INVENTORY tab, you see the Inventory page title with a menu icon, the query bar, and several sections, such as Explore Properties and Templates. Each section includes property names or query cards that you can click to get started with your search. To hide or open a section, click its title.
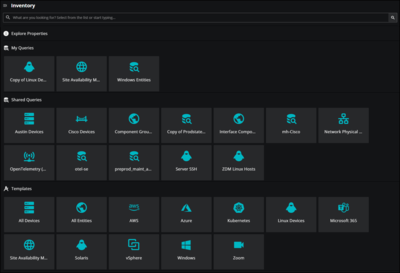
Let’s take a closer look at the main sections you might see on the initial page:
Natural Language Search for inventory
Natural Language Search in Virtana Service Observability turns a plain-language request into Query Builder filters, so you can find inventory items without building each filter by hand.
Natural Language Search is an AI-powered search bar at the top of the Inventory page. You describe what you want to find, for example, Linux devices in production. The search converts your request into filters in Query Builder, and the results grid shows the devices and entities that match. An entity is any item that Virtana Service Observability tracks in inventory, such as a device, a Kubernetes pod, or a cloud resource.

How Natural Language Search interprets a request
Natural Language Search identifies the inventory fields and values in your request and converts each one into a Query Builder filter. The search reads your inventory configuration each time you search, so it recognizes the fields, production states, and entity types in your environment, including custom ones. For example, the request linux device creates two filters joined by And: Schema Ids equal to Base.Device, and Device Class ends with /Linux.
When a request mentions devices, servers, or hosts, Natural Language Search adds a filter that limits the results to devices. A request that doesn't mention devices searches all entity types.
The words and and or combine conditions, and the word not excludes a value from a single condition. For example, windows or linux devices matches either operating system, and devices not in austin excludes one location.
A request can use either and or or for all of its conditions, but it can't mix them. For example, windows or linux devices in production doesn't return the results you might expect. To combine both, search with one of the words, and then add the remaining conditions in Query Builder.
Searchable fields and values vary by environment. To see which fields and values are available in your environment, check the attributes in Query Builder.
Natural Language Search and Query Builder
Natural Language Search gives you a starting point, and Query Builder gives you full control. The AI model can interpret an ambiguous request differently from what you intended. If Natural Language Search can't interpret part of your request, an inline warning identifies the terms that it couldn't interpret. After each search, review the generated filters in Query Builder and adjust them as needed.
If the Natural Language Search service is temporarily unavailable, you can still filter your inventory manually in Query Builder.
Search inventory with natural language
Describe the devices or entities you want in plain language, and Natural Language Search in Virtana Service Observability filters the inventory results for you.
Procedure
Open the Inventory page.
In the Natural Language Search bar, enter a description of what you want to find. For example, enter
urgent windows servers in production.Press Enter.
The results grid shows the matching items, and Query Builder shows the filters that the search created. Your request stays in the Natural Language Search bar so that you can edit it and search again.
Explore Properties
Click the section title to view a list of entity property names in your environment. By default, the list is hidden.
Once open, you can use the search field below the title to display a subset of properties. Note that the list doesn't include the internal properties that are generated by Virtana Service Observability.
My Queries
This section contains queries that you create and save. You can only see this section when you have saved queries.
When you mark a query as public, it's also added to the Shared Queries list. Click any query card to display its results.
Templates
This section contains the queries that Virtana provides. These templates are useful if you are new to using Inventory. Select a template to get started, customize it when viewing results, then save it as a query to use later or share with other users.
Accessing the Inventory panel
The Inventory panel provides a convenient method to access your saved and shared queries and templates, as well as your organizers from Collection Zone (CZ) if you are a CZ user.
To open the Inventory panel, click the Inventory menu icon in the upper-left corner of the page, then select either the QUERIES or ORGANIZERS tab.
Queries tab
In the QUERIES tab of the panel, you can open your favorites and most recently used queries. Additionally, you can share, edit, copy, and delete your queries.
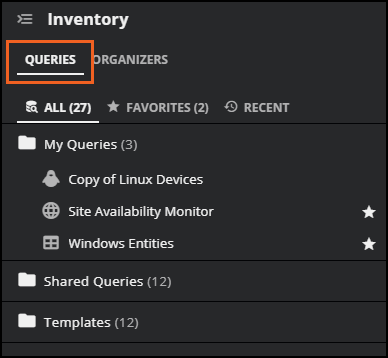
To display a different query, click the name of one of your queries in the My Queries folder, or open the Shared Queries folder and click the name of a shared query. You can also click the FAVORITES or RECENT tabs to find a query that you marked as a favorite or opened recently.
Note
The FAVORITES tab isn't available to read-only users because read-only users can't mark inventory queries as favorites.
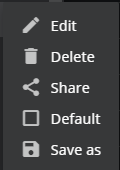
When you hover over an inventory query, you can click the Actions (⋮) menu to select different options, such as editing, deleting, or sharing the query, or setting it as your default user preference.
Organizers tab
If you created organizers in Collection Zones, you can view them in the ORGANIZERS tab of the Inventory panel. When you click the ORGANIZERS tab, the Devices organizer is open by default, matching the results in the table. The table name and the URL also reflect the default query.
If you want to browse through your devices using organizers, click the Inventory panel again to open the tree-like structure of organizers. Expand each organizer to view the folders and devices.
Selecting a specific organizer or device updates the table and the query to reflect your selection. For example, select Locations, then select a specific location, such as Austin. The table and query update to show only those devices that have a location of Austin.
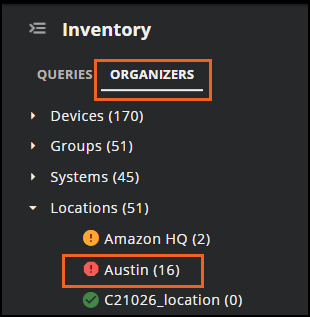
The table name and the URL also show that the query is now updated to just those results with a location of Austin.
Note
This view is for navigation and investigation only, so you can't save this view. Instead, use the QUERIES tab.
Organizer types
Organizers are groupings to help you categorize and access monitored devices.
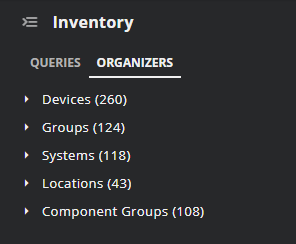
Devices are organized in the tree view by:
Devices. A device class is an implicit organizer that defines the base set of properties that characterize a group of devices. A device may belong to only one device class.
Groups. Groups let you organize multiple objects by their functions. For instance, you could use groups to sort objects by department.
Systems. This organizer is specifically designed to group virtual setups, such as those found in network configurations or systems categorized by their functionality.
Locations. Locations help you categorize devices based on where they’re physically located. A device can only have one location assigned, which can be broad like a city and state, or really specific like a particular server rack.
Component Groups. Component groups allow for flexible organization of device components.
Note
Organizers are set up in Collection Zone (CZ). To learn more, see Organizers in CZ.
Using organizers in Inventory
Let’s take a closer look at the organizers in the Inventory panel.
Click the down arrow next to each organizer to expand it and view its included devices.
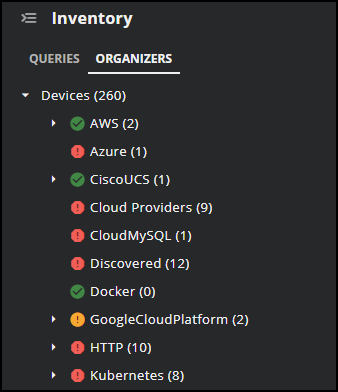
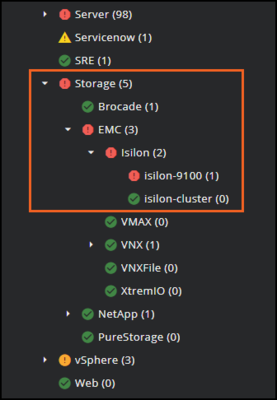
Each category or device class shows a count of devices within that category. For example, in the Devices organizer, the category of Storage appears with a “(5)” in parentheses. This number indicates that it contains five devices with a device class of “Storage” or starting with “Storage/”.
The icon next to the category or device class indicates the highest event severity among its contained devices. Only Critical (red), Error (orange), and Warning (yellow) severities are displayed. If a category shows with a green checkmark, then the category either has no devices with events or the category doesn’t contain any devices.
If you want to pinpoint the device or devices with a critical event, you can drill down into the folders. In this case, open Storage > EMC > Isilon. The critical event is associated with “isilon-9100” which you can open in the table to view the details.
If you select multiple devices or just one in your investigation, the table view is the same: one row per device and one column for each property. This table provides a snapshot of the included devices and their key details. To further refine your results, you can apply filters on the Device class, Name, and Location properties. This is useful when you have a large number of devices.
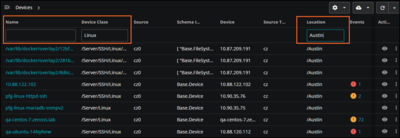
When finished, click the Settings menu to clear filters. Filters are not saved and only apply to your current search, so you can also clear the filters by navigating to a different category in Organizers.
To continue this process, see:
Viewing query results Learn how to view and interpret the results of your queries
Working with queries in Inventory Understand how to create, manage, and use queries within Inventory.
Advanced Inventory Actions Explore advanced actions you can perform to manage Inventory effectively.
About production states Learn about different production states and how they impact Inventory items.