Anomaly Labels
Container Observability provides a facility for users to provide feedback on the correctness of the anomalies detected by the ML system.
It helps in identifying and investigating unusual patterns or behaviors in the system's performance metrics, which could indicate potential issues. When the user determines that an anomaly is missed on a component, such as a false negative, or is detected incorrectly, such as a false positive, the user can set the Anomaly label to provide feedback or supervise the learning. This ensures that Container Observability’s ML system learns the correct behavior for that component if the same condition occurs again and avoids creating a false alert.
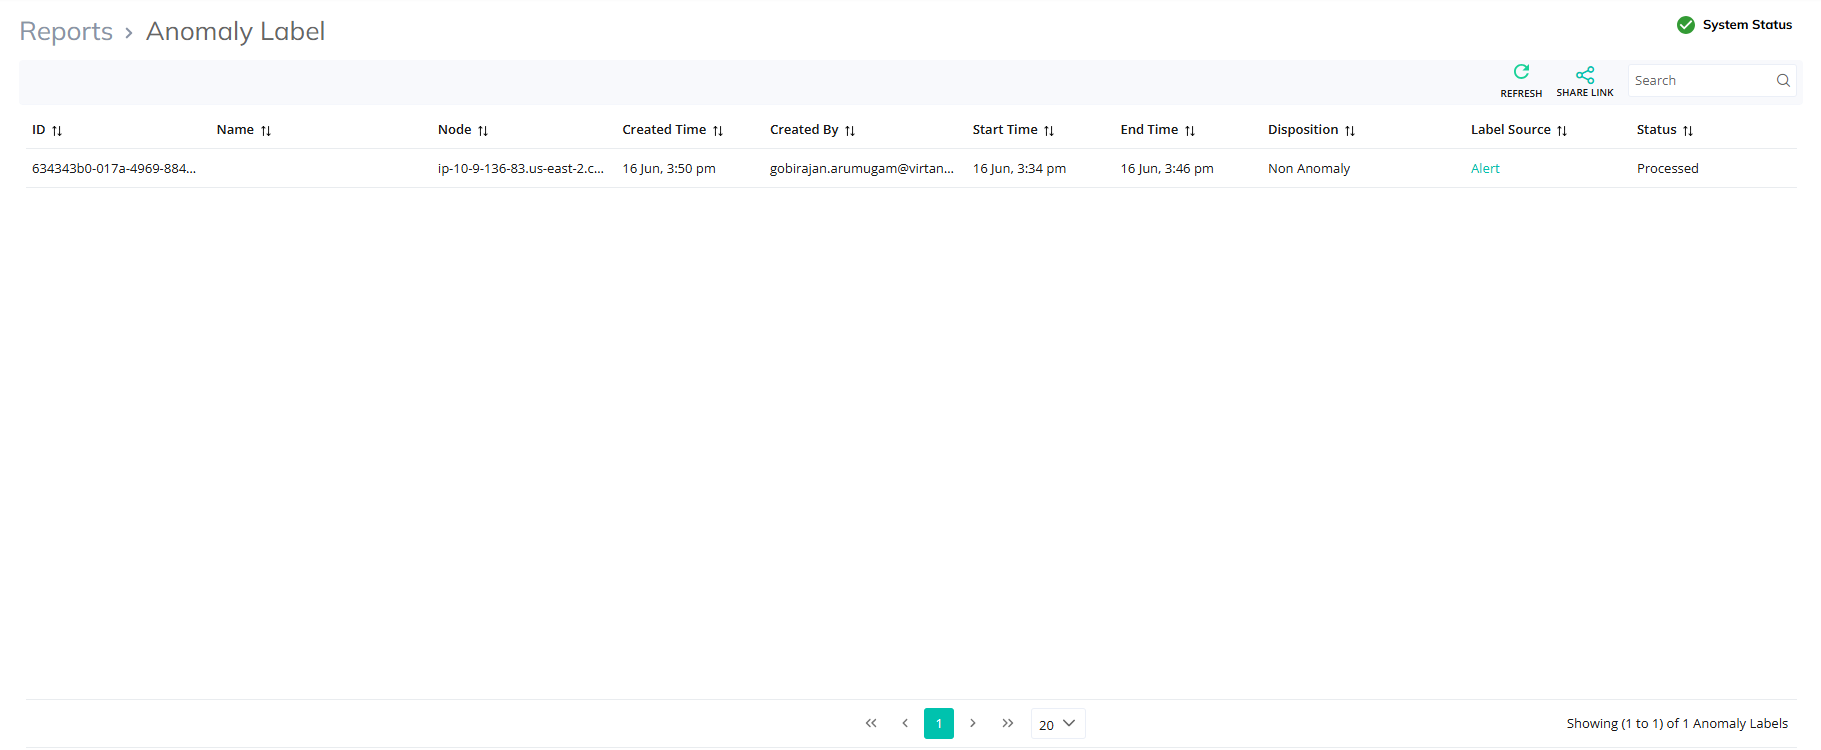
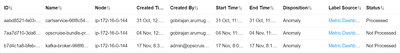
An anomaly label report describes the details of the following key components:
ID: A unique identifier for the anomaly label.
Name: The name or description of the anomaly.
Node: The node where the anomaly was detected.
Created Time: The timestamp when the label was created.
Created By: The user who created the label.
Start Time/End Time: The duration of the anomaly.
Disposition: The classification of the anomaly (e.g., non-anomaly).
Label Source: The source of the label (e.g., Alert).
Status: The processing status of the label (e.g., Processed).
The report can be filtered, and the user can search for specific labels using the search bar.
Analyze the alert in Alerts and mark it as non-anomaly under actions generated by ML.
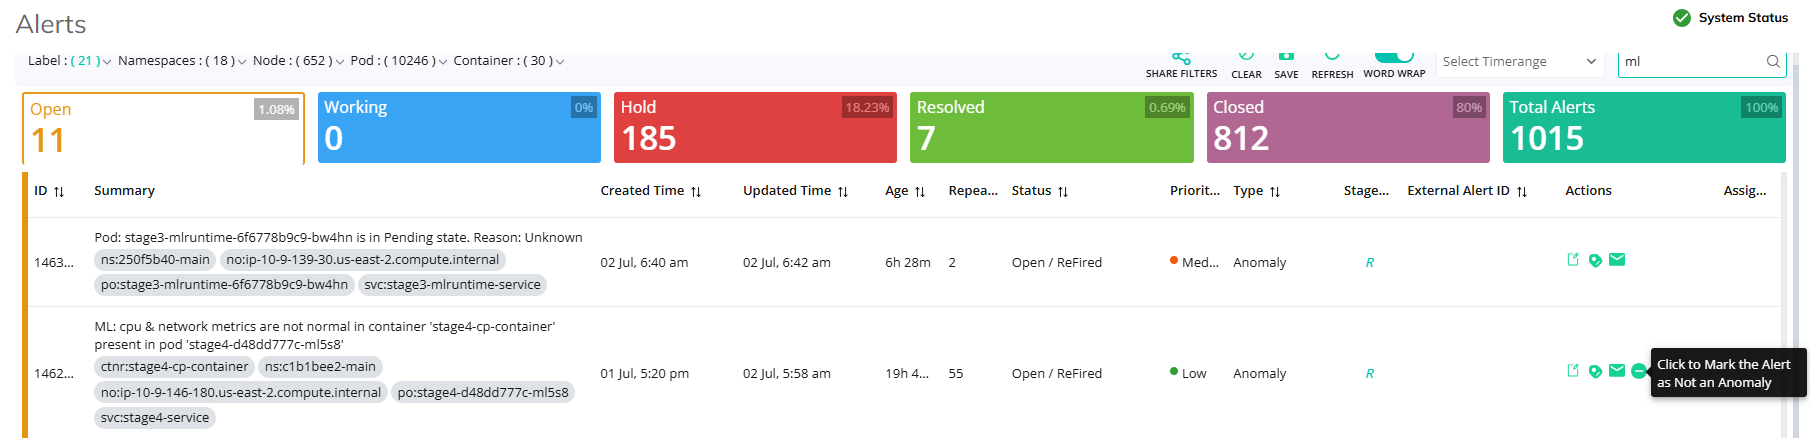
The anomaly alert will get displayed under Anomaly Labels in Reports.
Another way to add anomaly labels, follow these steps:
Log in to the Container Observability application.
On the sidebar menu, click Application > Node Map.
The Node Map page is displayed. The number of nodes with services will be displayed with the anomaly. You can also add an Anomaly label for any entity in the application.
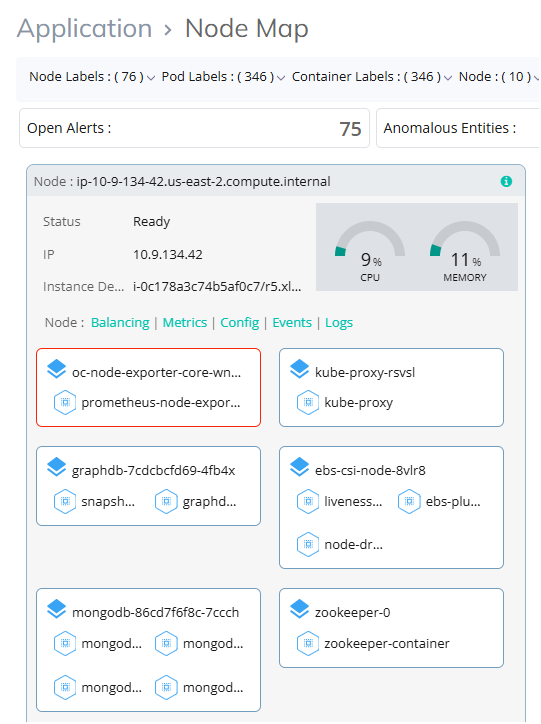
Click an affected server and then click Add Anomaly Label under Configuration Snapshot.
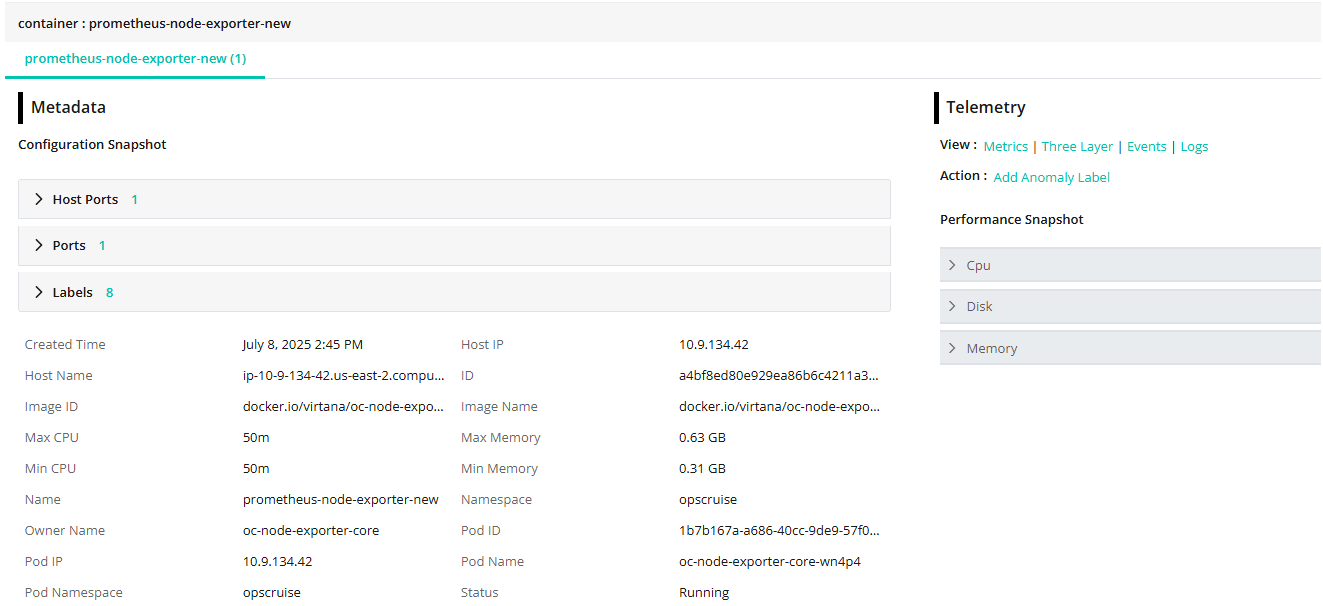
The graphical representation of the metrics will be displayed as follows.
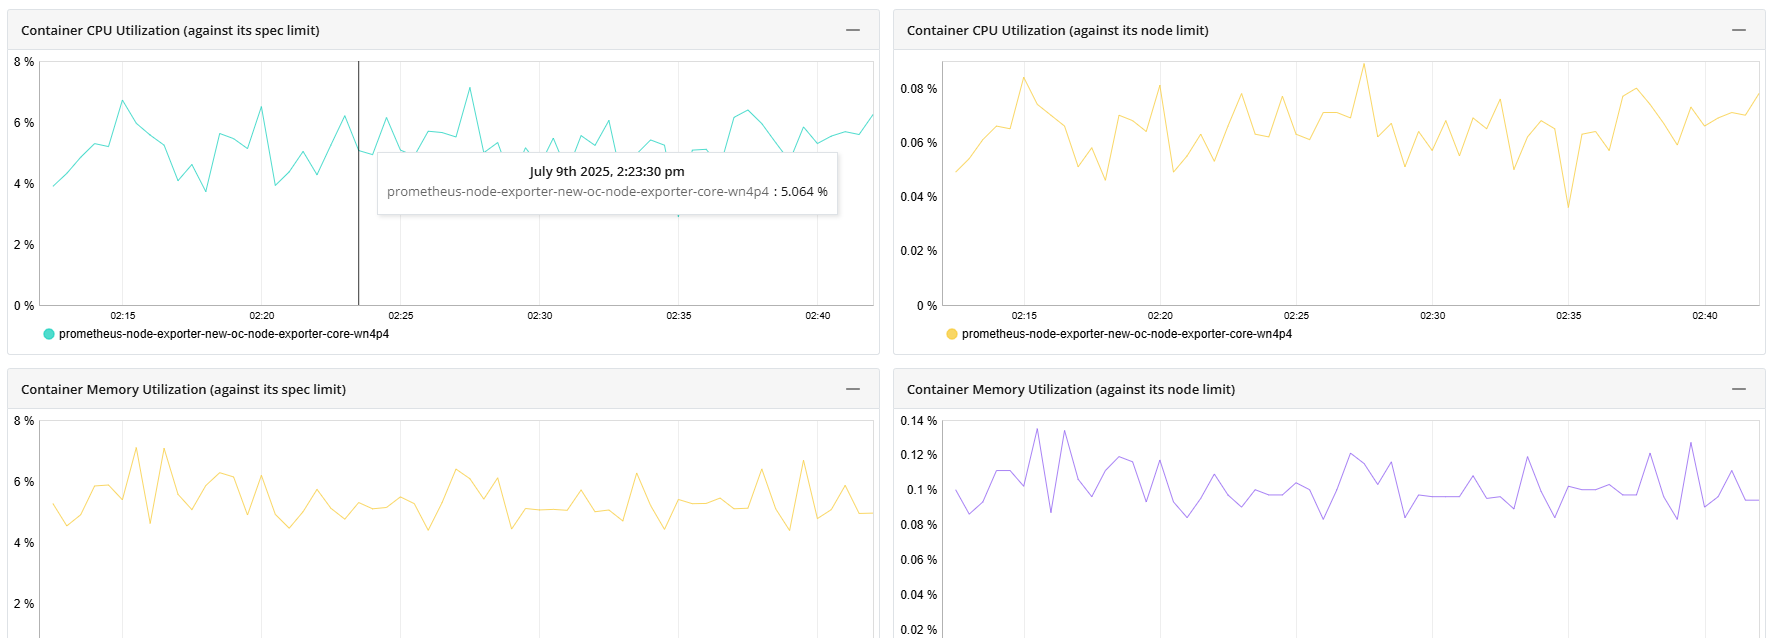
For a metric widget, select a time range to label it as an anomaly to create an alert notification as follows.
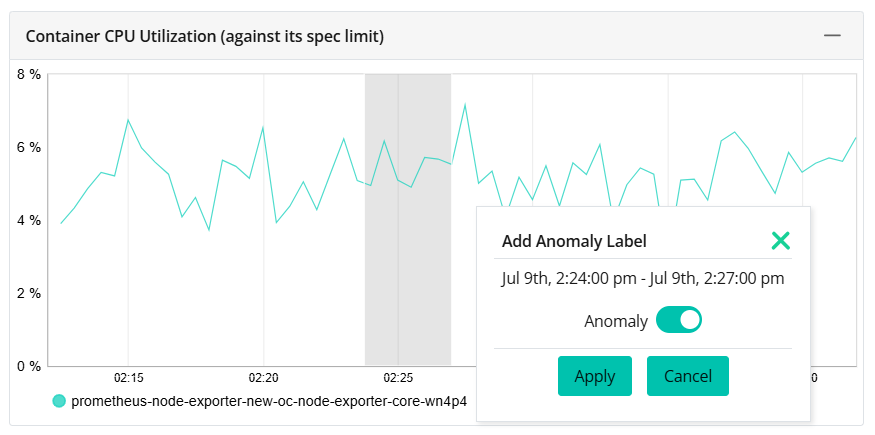
Click Apply.
The selected range gets added as an anomaly under the Anomaly Labels section in Dashboards as follows.
Note
You can also disable Anomaly to avoid alert notifications for the selected range.