Elements in Topology
This topic represents the different elements operating that are displayed in Topology. The following table represents the type of elements represented in Topology:
Element | Description | Metadata |
|---|---|---|
 | This icon represents Cloud applications or SaaS. | Click the cloud icon to view the following details:
|
 | This icon represents a defined service. Examples:
| Click this icon to view the following details:
|
 | This icon represents a container. A container is computed element or a ‘program’. | Click this icon to view:
|
 | This icon represents a Pod. A Pod is an atomic unit of deployment in Kubernetes. A Pod can contain multiple containers. | Click this icon to view:
|
 | This icon represents a public or private internet connection that interacts with the application environment. | Click this con to view:
|
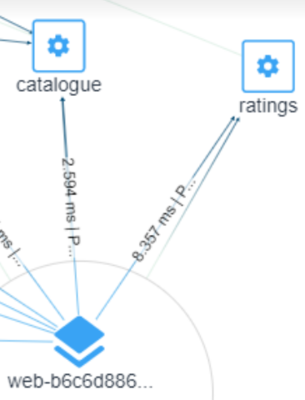 | This icon represents an interaction/communication link between two vertices | Click this icon to view:
|
Note
Note:
In the Filter bar, you can filter the type of Nodes, Labels, Pods, SaaS, Containers and Namespace to monitor and observe specifically in Topology.
In the top bar, to save any current page filtered as per your requirement, click Save.
Click Clear to remove the filtered options as per your requirement.
Click Refresh or select the Enable Auto-Refresh checkbox by choosing the desired time interval so that previous filtered items will be refreshed.