Kubernetes Optimization
Kubernetes Optimization helps you find pods that are underutilized, such as pods that reserve more CPU or memory than they actually use. Instead of manually inspecting workloads, you define a policy that sets CPU and memory thresholds for underutilized pods, and Global View evaluates your clusters against that policy each day. You can then review the results and right-size the affected workloads to reclaim wasted capacity.
View underutilized pods
The Underutilized Pods Summary shows the pods that the daily job flagged for the selected day. Open it from the Cluster Overview Dashboard panel, where the Underutilized Pods Summary lists each cluster and its underutilized-to-total pod counts.
For more information about the cluster dashboard that contains this summary, see Underutilized Pods Summary in the Cluster Overview Dashboard topic.
The summary groups results across several levels so you can drill from a cluster down to an individual pod. The grouping levels are:
Cluster name
Namespace
Entity type, such as Deployment or StatefulSet
Individual pod
For each entry, the summary reports the values described in the table below.
Column | What it shows |
|---|---|
Name | Cluster, namespace, entity, or pod name, depending on the grouping level. |
Entity Type | The Kubernetes object type, such as Cluster, Namespace, Deployment, or StatefulSet. |
Underutilized Pods | Number of underutilized pods in that row. |
Time Period | The From and To times for the evaluated day. |
CPU (Cores) | CPU request and limit usage, shown as % Request and % Limit. |
Memory (GiB) | Memory request and limit usage, shown as % Request and % Limit. |
Action | Opens the related action for the row. |
Use the search box, the Cluster filter, and the date selector at the top of the summary to narrow the results. To export the data, click Download. To see which policy produced the results, use the Underutilized Policy link, which opens the policy version that applied on the selected day.
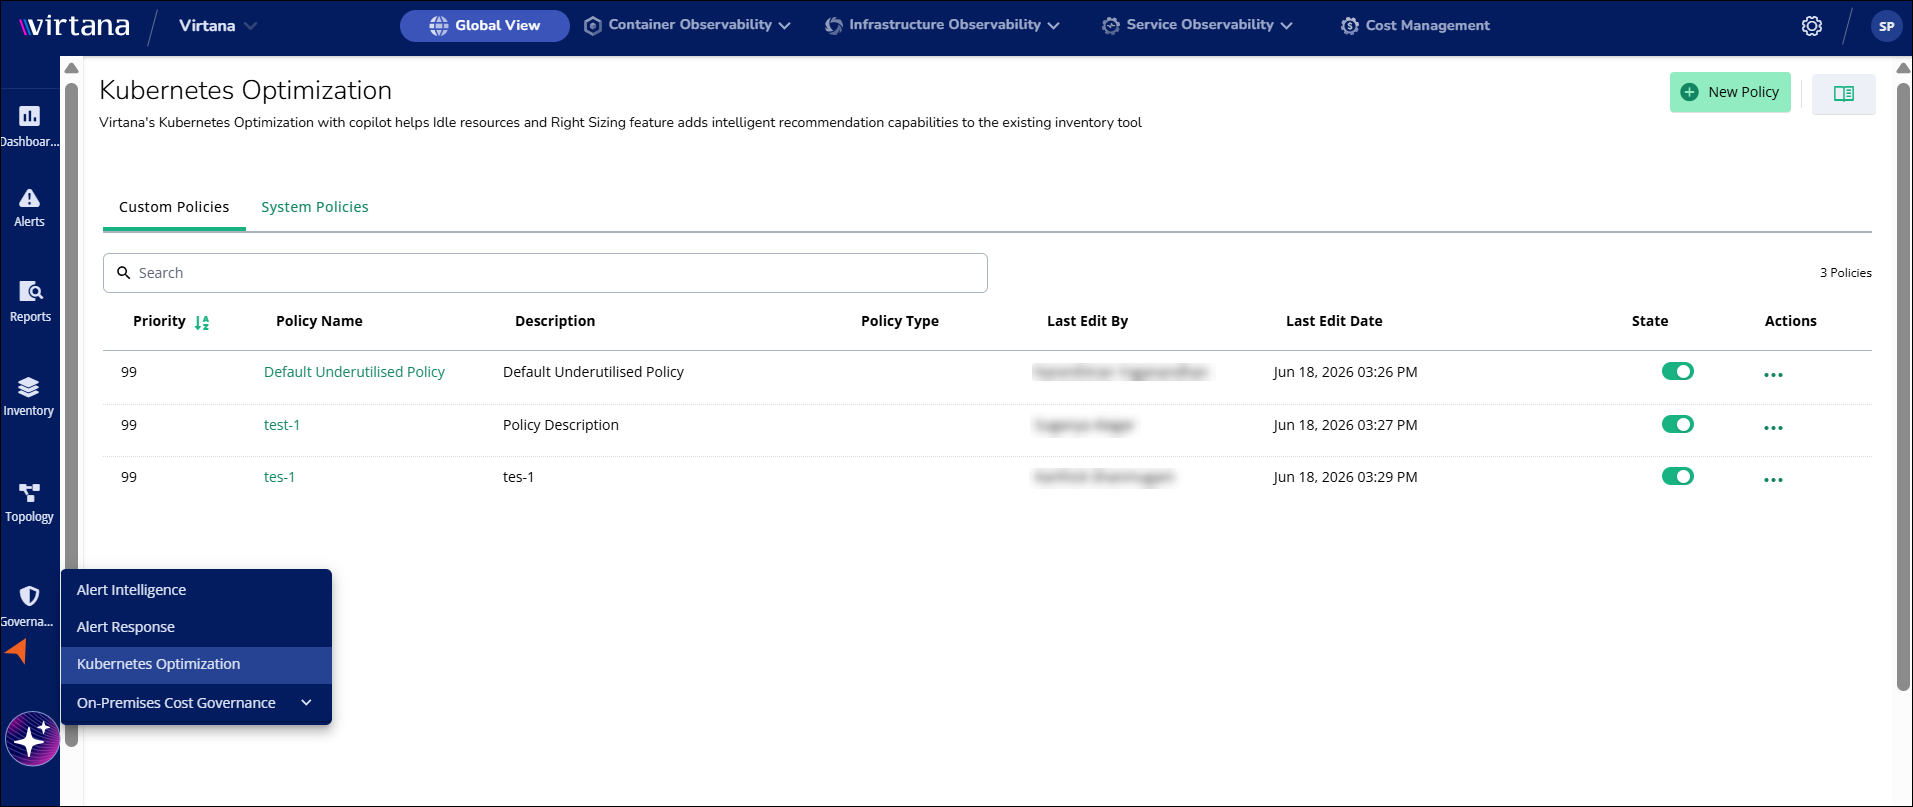
Open Kubernetes Optimization
Perform the following steps to open Kubernetes Optimization page:
Log in to the Virtana Platform and click Global View.
Go to Governance > Kubernetes Optimization.
The Kubernetes Optimization page opens.
Kubernetes Optimization workflow
Kubernetes optimization runs as a daily evaluation that compares each pod's real usage against the thresholds in the active policy. The workflow has three parts:
Create a policy: Define the CPU and memory thresholds that mark a pod as underutilized. Select the clusters or resource groups where the policy should be applied.
Evaluate daily pod: A background job runs once per day to evaluate pod usage.It measures resource consumption for the previous day and flags pods that fall below both CPU and memory thresholds.
Review optimization results: Open the Underutilized Pods Summary to analyze findings. Review underutilized pods across namespaces and clusters, and identify opportunities to reduce resource requests and limits.
How a pod is flagged as underutilized
A pod is flagged only when it meets the policy's usage criteria for the previous day. The criteria below determine which pods appear in your results.
CPU and memory must both be underutilized
A pod is flagged as underutilized only when its CPU usage and its memory usage are both below their thresholds. Kubernetes optimization uses an AND condition between CPU and memory, so a pod that wastes one resource but uses the other normally is not flagged.
For example, with a policy of 50% CPU and 50% memory on a pod that has 2 CPU cores and 2 GiB of memory: if the pod uses only 100 millicores of CPU (about 5% of its request) but more than 1 GiB of memory (above 50%), it is not flagged, even though its CPU is clearly underused. Since both conditions must be true, a pod can waste CPU yet still pass. An OR condition between CPU and memory is not supported.
Measure thresholds
Each threshold is a percentage of the resource that the pod requests. The unit is always percentage. A CPU value of 10 means, 10% of the requested CPU, for example, for a pod that requests 1 CPU core, the policy flags usage below 100 millicores (m). A memory value of 50 means, 50% of the requested memory, for example, for a pod that requests 2 GiB, the policy flags usage below 1 GiB.
Supported entity types
Kubernetes optimization evaluates pods that belong to one of three workload types, such as Deployment, DaemonSet, or StatefulSet. Pods managed by other controller types (such as Jobs or CronJobs) or standalone pods are not evaluated.
If a policy targets a resource group that contains none of these workload types, Global View applies the default policy instead.
Default policy thresholds
When no custom policy applies to a cluster, Global View uses a built-in default policy. The default policy flags a pod when it uses less than 15% of its requested CPU and less than 15% of its requested memory for the previous day.
Custom policies and system policies
The Kubernetes Optimization page separates policies into two tabs so you can tell apart the policies you create from those that Virtana provides.
Custom policies
Custom policies are the policies you create, either by writing YAML or by entering values manually. You can edit, enable, disable, and re-prioritize your own custom policies at any time. All policies you create appear on the Custom Policies tab.
System policies
System policies are predefined policies that Virtana provides, and you can't edit them directly. If a system policy doesn't meet your needs, create a custom policy with the thresholds you want instead. Clusters without a predefined policies and custom policies can use the default thresholds of 15% CPU and 15% memory.
Set policy priority with precedence
Precedence decides which policy wins when more than one policy applies to the same cluster. Precedence is a number from 1 to 99, where a lower number means a higher priority. When several policies target one cluster, Global View applies the policy with the highest priority (the lowest precedence number).
To change a policy's precedence, open its Actions menu on the Kubernetes Optimization page and choose a priority. Setting a policy to the highest priority changes its precedence to 1 and setting it to the lowest priority changes its precedence to 99.
Create a policy
You can create a custom policy in two ways: by writing YAML or by entering values manually in the form. Open either method from the New Policy button on the Kubernetes Optimization page.
Use the YAML editor when you want to define a policy quickly or reuse a policy definition. To create a policy with YAML:
On the Kubernetes Optimization page, click New Policy.
In the Generate Policy panel, edit the YAML template.
The template includes every supported field with an inline comment that explains it.
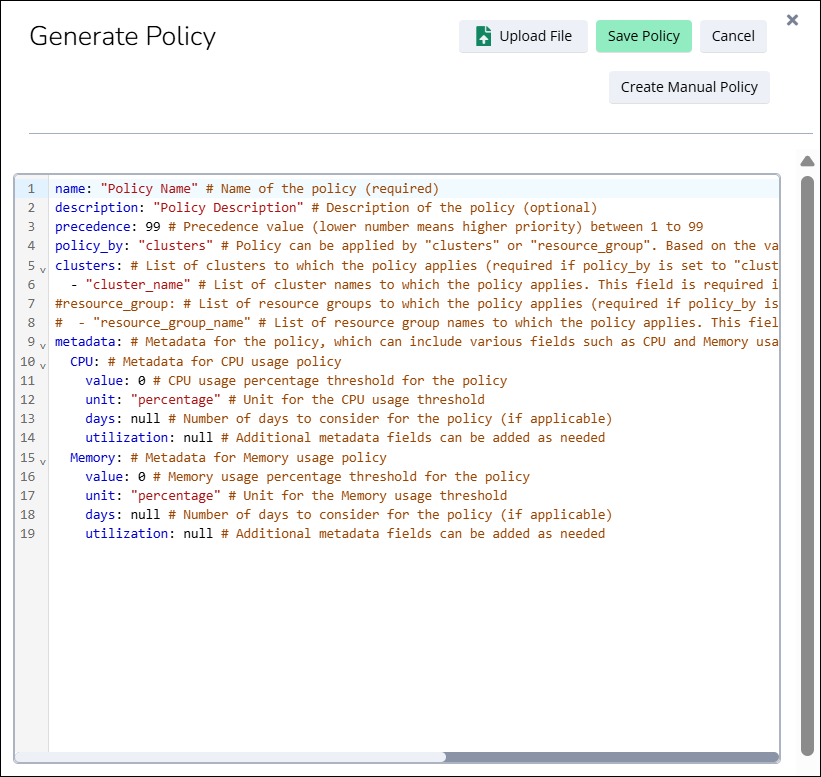
Set
policy_bytoclustersorresource_groups, then list the cluster names or resource group names the policy applies to.Set the CPU and memory
valuethresholds, and setprecedenceto control priority among policies.Click Save Policy.
The new policy appears on the Custom Policies tab.
The following YAML template shows the structure and the supported fields:
name: "Policy Name"
description: "Policy Description"
precedence: 99
policy_by: "clusters"
clusters:
  - "cluster_name"
#resource_group:
#  - "resource_group_name"
metadata:
  CPU:
    value: 0
    unit: "percentage"
    days: null
    utilization: null
  Memory:
    value: 0
    unit: "percentage"
    days: null
    utilization: null
The table below describes each field in the YAML template, including whether the field is required and what values it accepts.
Parameter | Description | Required |
|---|---|---|
| Name of the policy. | Yes |
| Free-text description of what the policy does. | No |
| Priority of the policy, from 1 to 99. A lower number is a higher priority. Default is 99. | No |
| Whether the policy targets clusters or resource groups. Accepts | Yes |
| List of cluster names the policy applies to. Required when | Conditional |
| List of resource group names the policy applies to. Required when | Conditional |
| CPU usage threshold as a percentage of requested CPU. Usage below this value counts as underutilized. | Yes |
| Memory usage threshold as a percentage of requested memory. Usage below this value counts as underutilized. | Yes |
| Unit for the CPU and memory thresholds. Only | Yes |
| Reserved fields for future use. Leave as | No |
Use the manual form when you prefer to enter values in fields rather than edit YAML. To create a policy manually:
On the Kubernetes Optimization page, click New Policy, then click Create Manual Policy.
The Underutilized Pods Policy window opens. You can edit the Default Underutilized Policy name.
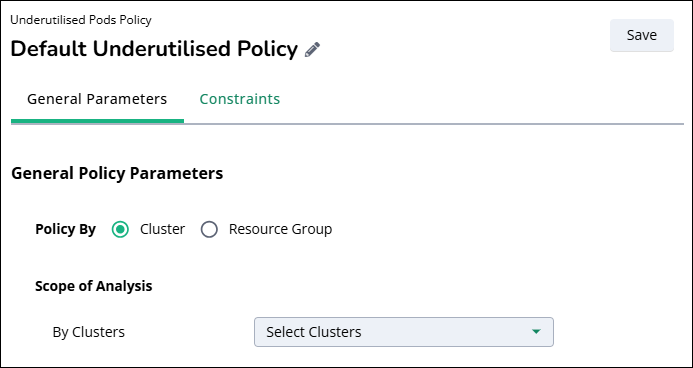
On the General Parameters tab, set Policy By to clusters or resource groups, then choose the clusters or resource groups in Scope of Analysis.
On the Constraints tab, set the CPU and memory thresholds under Basic Constraints For Underutilized. For each resource, enter the percentage of spec utilization and the number of days the pod must stay underutilized.
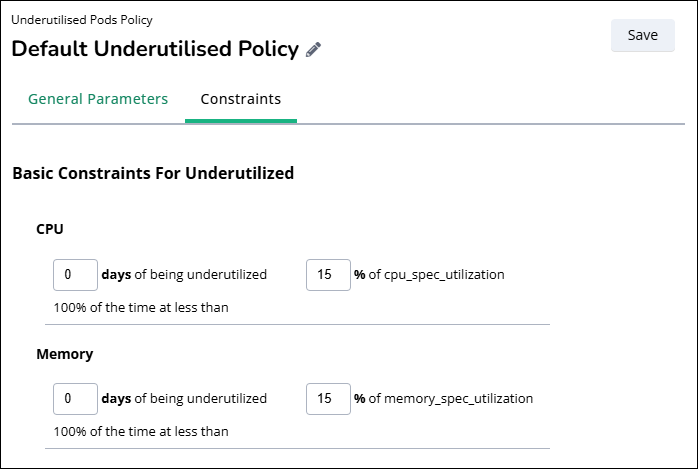
Click Save to create the policy.
Manage policies
After you create a policy, you can edit its parameters, turn it on or off, and review earlier versions. You manage all of these from the Kubernetes Optimization page.
Edit a policy
Editing a policy lets you change its scope or thresholds without recreating it. To edit a policy:
On the Kubernetes Optimization page, click the policy name to open it.
Click Edit Policy.
On the General Parameters tab, review the policy scope, such as Policy By and the clusters in Scope of Analysis.
On the Constraints tab, change the CPU and memory thresholds. Each constraint sets the percentage of spec utilization and the number of days the pod must remain underutilized.
Click Save.
Note
Every time you save an edit, Kubernetes optimization creates a new version of the policy. See Policy versions for how earlier versions are used.
Enable or disable a policy
Disabling a policy stops Global View from applying it, but keeps the policy so you can use it again later. This is useful when you want to pause a policy for a cluster without losing its definition. To turn a policy off, set its State option to disabled on the Kubernetes Optimization page and to turn it back on, set the State option to enabled.
Policy versions
Policy versions let you see which thresholds were in effect on a given day. Because each edit creates a new version, the results for a past day reflect the policy version that applied on that day, not the current version.
For example, a policy used a 90% threshold one day before and you change it to 50% on current day. When you view yesterday's underutilized pods, the results use the 90% version that applied then. To see the exact thresholds behind a past result, open the policy from that day's results. The policy shows the version that applied on that day rather than the current version.