Monitoring using zencommand
You can use your Collection Zone to run commands and scripts using COMMAND-type data sources. These data sources are executed by the zencommand process, either locally in the zencommand container on the collector or remotely on a monitored device. You can use zencommand to capture performance metrics as data points and to generate events based on the return code of the command.
Data source options
When creating or editing a COMMAND type data source, you will be presented with the following options:
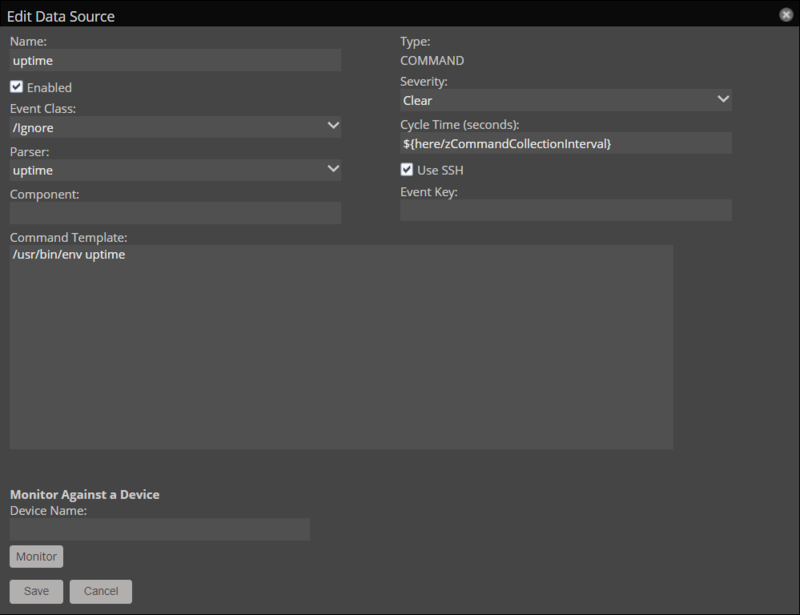
Field | Default value | Description |
|---|---|---|
Name | Enter a name for the data source. | |
Enabled | True | Select this checkbox to activate the data source for this template. Clear the checckbox to disable the data source. |
Event Class | /Cmd/Fail | Specify the event class to use when sending events to the system when the command exits with a non-zero return code. The event class applies to events that are generated directly by the data source. Events that are generated by threshold evaluations use their configured event class. |
Parser | Auto | Specify the script that decodes the output of a command and converts it to one or more data points or events. For more information, see parsers. |
Component | Enter the component name to use when zencommand sends events to the system. | |
Severity | Warning | Set the default severity to use when sending events to the system in the event of a non-zero return code. When the command exits with a 0 return code, the event severity is set to 0 (Clear). Events generated by threshold evaluations use their configured severity. |
Cycle Time |
| Set the frequency that a command runs in seconds. You can can set this values to a positive integer, or the value of zCommandCollectionInterval through a TALES evaluation (i.e, |
Use SSH | False | Select this checkbox if you want the zencommand to execute the Command Template over a remote session to the monitored device using the protocol specified by the zCommandProtocol configuration property. Clear this checkbox if you want the zencommand to execute the Command Template inside the zencommand service container on the collector host where it's currently running. |
Event Key | Enter a custom event key for any events generated by the data source. This event key applies to events generated directly by the data source. Events generated by threshold evaluations use their configured event key. | |
Command Template | Enter the command to run. For more information, see Command Template options. |
Command Template options
The Command Template specifies the command to run.
Zencommand builds the command template string by using Zope TALES expressions. The following variables are available when evaluating the template:
Variable | Description |
|---|---|
zCommandPath | Path to the executable commands or scripts on a given collector or device. This comes from the configuration property zCommandPath. zCommandPath is automatically added to a command if a path is absent from the beginning of the command. |
devname | Device name of the device against which the command is being evaluated. |
dev | Device object against which the command is being evaluated. |
here | Context of evaluation. For a device, this is equivalent to dev. For a component (such as a file system or interface), this is the component object. Can be seen on component templates as |
compname | The name of the component as a string, if this command is evaluated against a component. |
now | Current time. |
Virtana accesses template values much like shell variables. You can view examples of these and other expressions on templates in the /Server/SSH/ sub-classes.
For more information, see TALES expressions.
Note
TALES evaluation of the command template field treat instances of the dollar sign character ($) as the beginning of a TALES expression. If your command uses a $ character that is not part of a TALES expression, you must escape it with another $. For example, to use the following command
export PATH=$PATH:/bin:/sbin:/usr/bin:/usr/sbin
edit it to the following format:
export PATH=$$PATH:/bin:/sbin:/usr/bin:/usr/sbin
Parsers
To convert the output from a command or script into one or more data points or events, COMMAND data sources use a parser.
The following parsers are built into the Collection Zone:
Cacti
Nagios
Auto
JSON
ps
uptime
Other parsers are included in ZenPacks that monitor devices over SSH, for example, ZenPacks.zenoss.LinuxMonitor.parsers.linux.ps.
The set of data points configured in the data source must correspond to the set of metrics returned by the parser.
Cacti
The format expected by the Cacti parser is:
datapoint1:1234 datapoint2:9876
Assuming an uptime data source with data points named, 1min, 5min, and 15min, the output might look like:
1min:1.11 5min:2.12 15min:2.59
For more information, see the Cacti manual.
Nagios
The format expected by the Nagios parser is:
Descriptive text, Datapoint 1 = 1234, Datapoint 2 = 9876 | datapoint1=1234, datapoint2=9876
The "pipe" character (|) splits the output into two parts.
The first part contains descriptive text and optional "friendly" representations of the collected metrics. This part is used as the message of any events generated by the data source.
The second part contains the collected metrics that are actually parsed and stored in the data points configured on the data source.
Assuming an uptime data source with data points named, 1min, 5min, and 15min, the output might look like:
Uptime: 48 days, 3 hours, 45 minutes. Loads: 1.11, 2.12, 2.59 | 1min=1.11, 5min=2.12, 15min=2.59
For more information, see Nagios Core - Performance Data.
Auto
The Auto parser will attempt to interpret the output of a command as Nagios. If this fails, it will attempt to parse the output as Cacti.
JSON
The JSON parser can extract data points and multiple events from a string of JSON formatted text.
The expected format is:
{
  "values":{
    "":{
      "datapoint1":1234,
      "datapoint2":9876
    }
  },
  "events":[
    {
      "severity":0,
      "summary":"A summary of the event",
      "eventKey":"some_event_key",
      "eventClass":"/Some/Event/Class"
    }
  ]
}
The "values":{} section can include data points from a device or from its components. If the metrics are from a device, format the "values":{} section as in the previous code sample. The blank string ("":{}) indicates that the following values are intended for the device.
If the data source is gathering component metrics, the "values":{} section must include each component name and the data points belonging to that component:
{
  "values":{
    "component1":{
      "datapoint1":1234
    },
    "component2":{
      "datapoint1":5678
    }
  },
  "events":[]
}
The ps and uptime parsers
The ps and uptime parsers are included in templates that belong to the /Server/SSH/AIX device class. Because of differences in command output between various Unix and Linux distributions, these parsers are unlikely to work well with a user-created data source.
Walkthrough: Creating a COMMAND data source
By following the steps below, you can create a COMMAND data source that checks a Linux /tmp directory for size and file count.
This walkthrough process asssumes that:
You are monitoring devices in the /Server/SSH/Linux device class.
You have chosen one of these devices to test the new data source against.
The monitoring user account specified in zCommandUsername is
zenmonitor.The selected script called by the command data source (see Walkthrough scripts) is already in place on the target device in
/home/zenmonitor/scripts/.The selected script is executable by the user account specified in zCommandUsername.
Note
This walkthrough is designed to illustrate the process of creating a COMMAND data source using a specific example. We recommend that you perform this walkthrough in a test environment. It is not intended for production use. Because of differences in OS versions, distributions, and more, it is possible that these steps may fail in your environment.
Walkthrough process steps
This walkthrough consists of the following steps that walk you through creating a template to deploying it to production. Following the steps are scripts that you can use for testing.
We recommend that you perform this walkthrough in your test environment. It is not inteneded for production use.
In addition to these tasks, this walkthrough includes scripts that are used in the example.
Step One: Create a template
Creating and testing a new data source is best performed on a new, unbound monitoring template. This prevents the data source from applying to unintended devices and generating events while it is being configured.
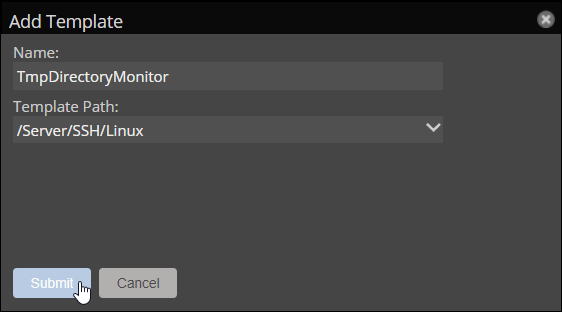
In the Collection Zone user interface, navigate to ADVANCED > Monitoring Templates.
Click the Add a monitoring template (+) button in the lower left corner.
Enter a name for the template:
TmpDirectoryMonitor.Select
/Server/SSH/Linuxin the Path dropdown list.Click Submit.
Step Two: Add a data source
The new template contains a single data source. Be sure that the name of the data source is recognizable by your users.
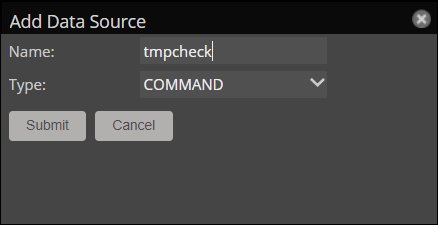
Click the Add data source (+) button in the top left.
Enter a name for the data source:
tmpcheck.Select
COMMANDin the Type dropdown list.Click Submit.
Step Three: Configure the data source
The data source remotely invokes a script installed on the target device.
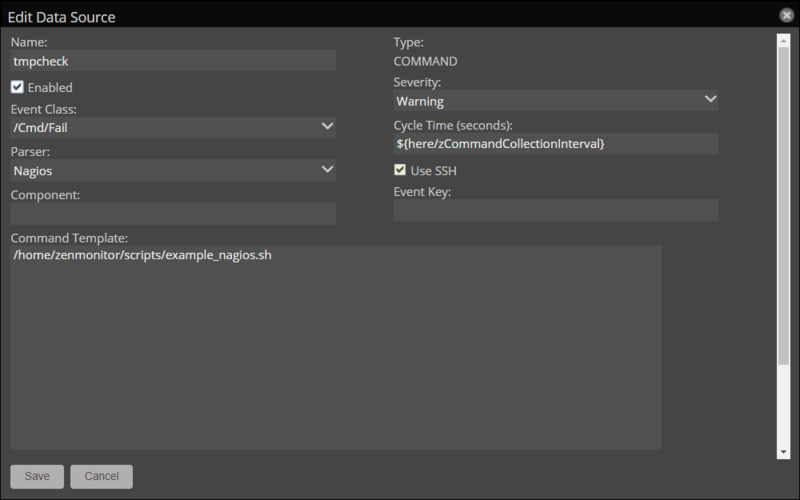
Double-click the data source.
Command Template
/home/zenmonitor/scripts/example_cacti.sh/home/zenmonitor/scripts/example_json.sh/home/zenmonitor/scripts/example_nagios.sh
In the Parser dropdown list, choose the parser that matches the script (
Cacti,JSON, orNagios).Select the Use SSH checkbox.
Click Save.
Step Four: Add data points
The script called by the data source returns two data points. The data source must have matching data points so that the parser can store them.
Note
Data point names are case sensitive.
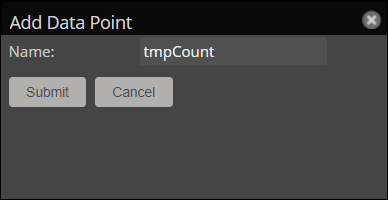
In the data source Actions menu (gear icon), select Add Data Point.
Enter a name for the data point:
tmpCount.Click Submit.
Repeat steps 1-3 in this task for the
tmpSizedata point.
Step Five: Create graph definitions
Each data point has its own configured graph definition. While you can use a single graph to display both data points, the size of the tmpSize metric might mask the value of tmpCount.
In the Graph Definitions section of the page, click the Add graph definition (+) button.
Enter the name for the graph as
Count, then click Submit.Click the Count graph definition to select it.
In the graph definition Actions menu (gear icon), select Manage Graph Points.
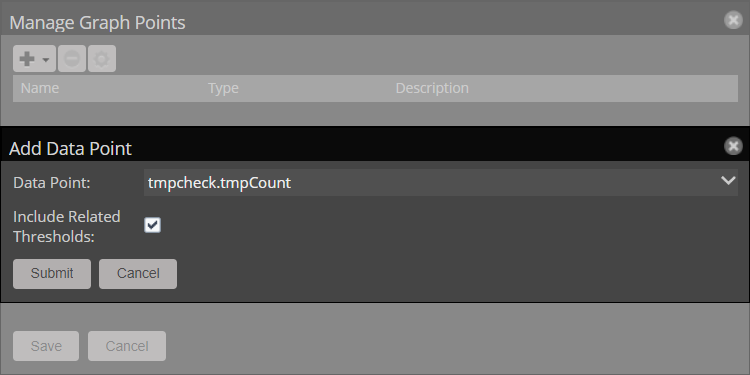
In the Manage Graph Points dialog box, open the + menu and choose Data Point.
In the Data Point dropdown list, choose
tmpcheck.tmpCount, and click Submit.Click Save.
Double-click the Count graph definition.
View and Edit Graph Definition
Units:
FilesMin Y:
0
Click Submit.
Repeat steps 1-10 in this task to create the Size graph, using the
tmpcheck.tmpSizedata point,Bytesfor the Units, and0for Min Y.
Step Six: Test the template
Choose a single device to bind the template to for testing. We recommend that this device be a "test" or "QA" device with a Production State below "Production," or otherwise configured to not match any active event Triggers.
In INFRASTRUCTURE > DEVICES, navigate to the selected test device.
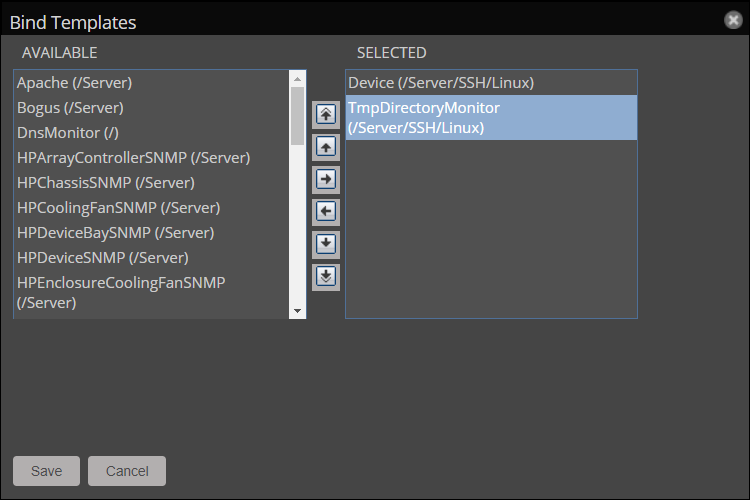
In the Actions menu (gear icon) in the lower left corner, select Bind Templates.
In the AVAILABLE column, select the TmpDirectoryMonitor template.
SELECTED
Double-click the template name.
Click the template name, then click the Add to Selected ("right arrow") button.
Click SAVE.
In the bottom left corner of the device page, select Monitoring, and then choose either Collect Device data or Collect Device data (Debug).
Check the Graphs page for the device to confirm that metrics are saved.
Step Seven: Deploying to production
After testing a template against a single device and confirming it works as intended, you might want to apply it to additional devices or device classes.
If this template was intended for actual production use, these steps would apply the template to all devices in the /Server/SSH/Linux class and any subclasses.
In INFRASTRUCTURE > DEVICES, navigate to the chosen test device.
In the Actions menu (gear icon) in the lower left, select Bind Templates.
In the SELECTED column, choose the TmpDirectoryMonitor template.
AVAILABLE
Double-click the template name.
Click the template name, then click the Remove from Selected ("left arrow") button.
Click SAVE.
Navigate to ADVANCED > Monitoring Templates.
Select the TmpDirectoryMonitor template in the left pane.
In the bottom-left template Actions menu (gear icon), select Toggle Template Binding.
Walkthrough scripts
The scripts below are designed to check the /tmp directory for size and the number of files it contains. They then return both values in one of the general purpose parser formats supported by command data sources.
Note
The following scripts are intended only to demonstrate the output formats recognized by each parser. They are not intended for production use and might not work in your environment.
```sh title="example_cacti.sh"
Testing COMMAND data sources
In Virtana Service Observability, you can test COMMAND data sources directly from the Edit Data Source window.
To test a data source from the Collection Zone GUI:
Navigate to the template containing the data source to test.
Double-click the data source to open the Edit Data Source window.
In the Monitor Against a Device field, provide a device ID.
Click Monitor.
Note
If your data source has any unsaved changes, click Save and reopen the data source before testing.
The Monitor function will only test the saved configuration of the data source.
Using 3rd party plugins
COMMAND data sources can be used to execute Nagios or Cacti plugins. Output from these plugins can be parsed by zencommand as long as the appropriate parser (Nagios or Cacti) is configured.
These plugins are not provided by Virtana.
Nagios return codes
Nagios plugins are configured to provide a POSIX return code when they return data. The Nagios parser uses this return code to set the severity of the generated event.
The return codes and their mappings to Virtana event severities can be seen in the following table:
Nagios service status | Return code | Virtana event severity |
|---|---|---|
OK | 0 | Clear |
WARNING | 1 | As configured on data source |
CRITICAL | 2 | As configured on data source + 1 |
UNKNOWN | 3 | As configured on data source |
For comprehensive information about Nagios® plugins, refer to the Nagios® Plugins Development Guidelines.