Cluster Dashboard
The Cluster Dashboard is a centralized monitoring interface that provides visibility into the health, performance, and behavior of the core control plane components of a Kubernetes cluster. It aggregates and visualizes real-time and historical metrics to help operators monitor, troubleshoot, and optimize the cluster's orchestration layer.
It covers below list of metrics for the control plane components.
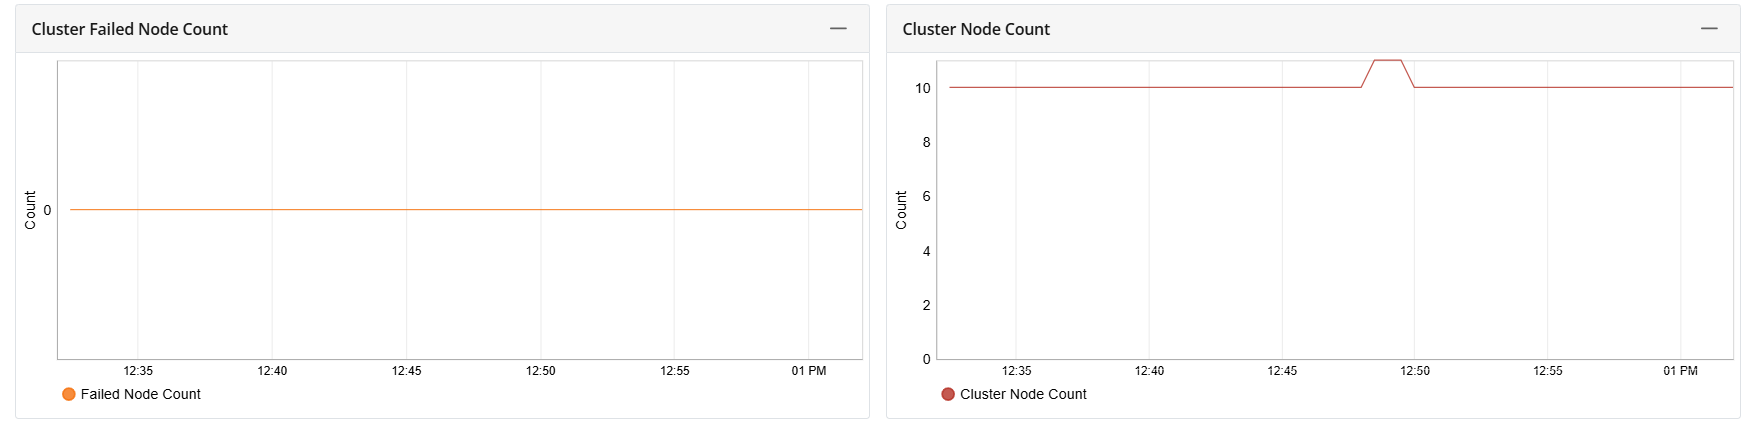
Cluster Failed Node Count and Cluster Node Count: Displays graphically the number of nodes in a failed state and the total number of nodes in the cluster (active or registered).
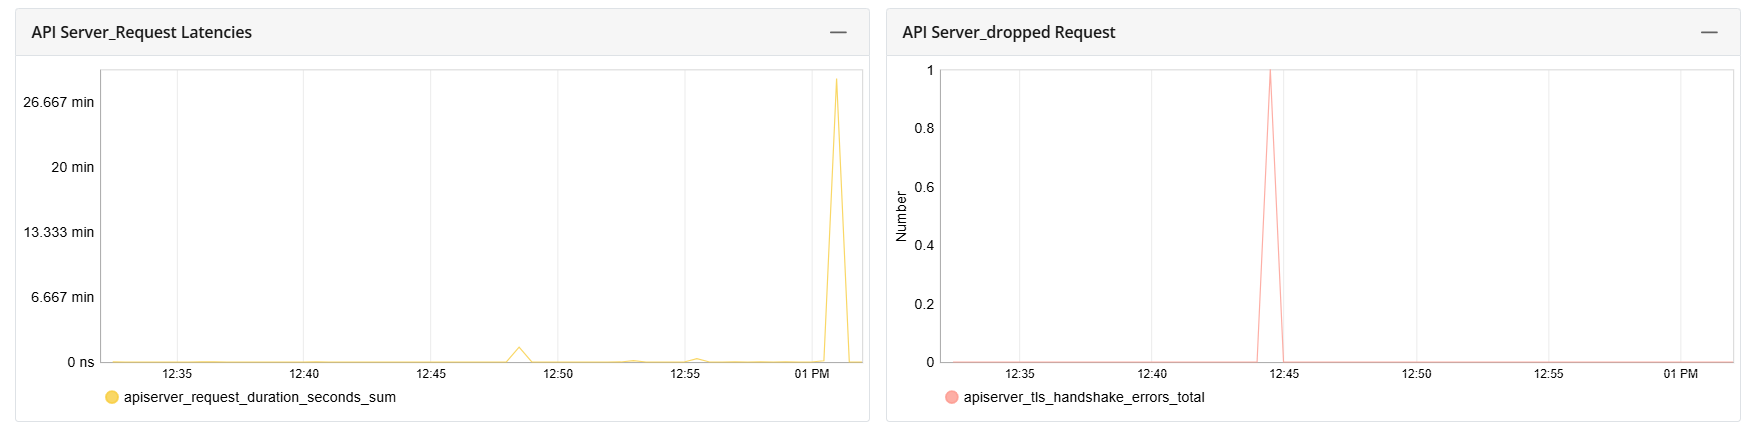
API Server Request Latencies and API Server Dropped Request: Displays graphically the total cumulative duration of all API requests over time and the count of TLS handshake error, i.e., API requests that were dropped due to TLS negotiation failure.
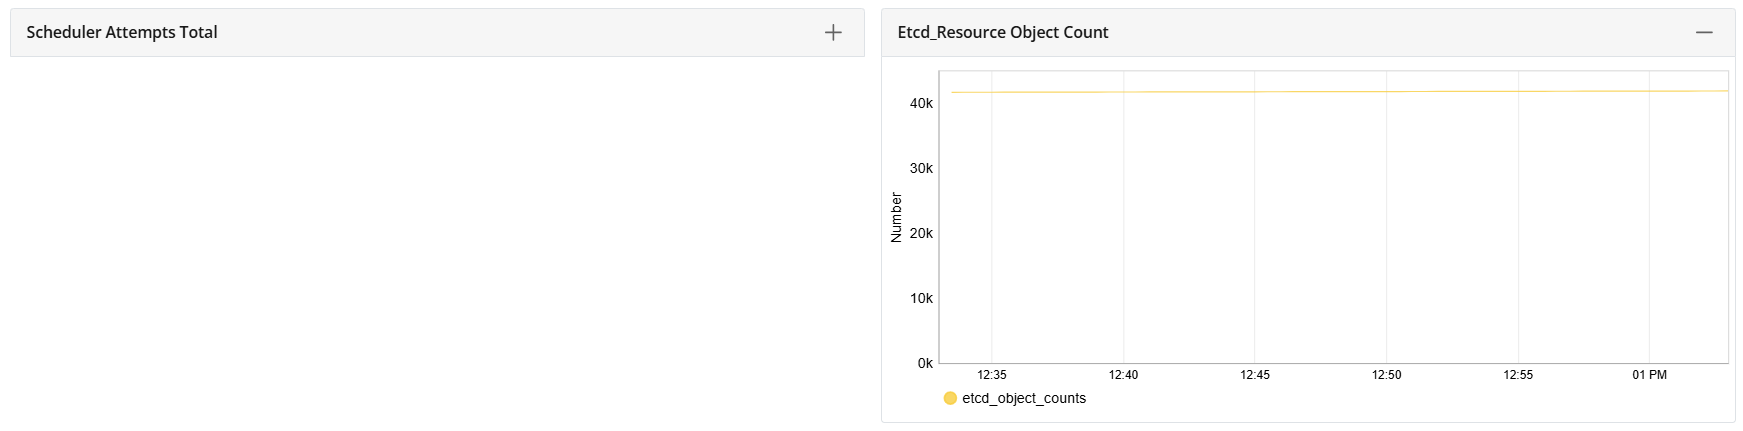
Scheduler Attempts Total and Etcd Resource Object Count: Displays graphically the number of pod scheduling attempts made by the Kubernetes scheduler and the number of Kubernetes objects stored in Etcd, the cluster’s key-value store (used for persisting all cluster state).
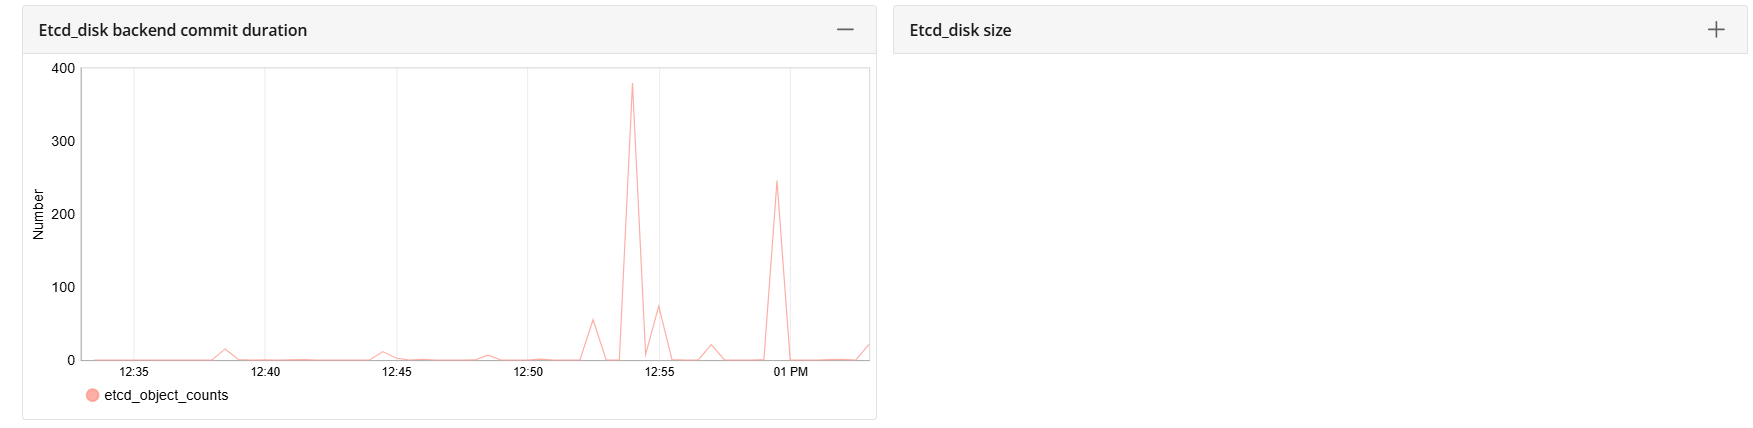
Etcd Disk Backend Commit Duration and Etcd Disk Size: Displays graphically the duration of Etcd disk write (commit) operations over time and the size of Etcd database file on disk.
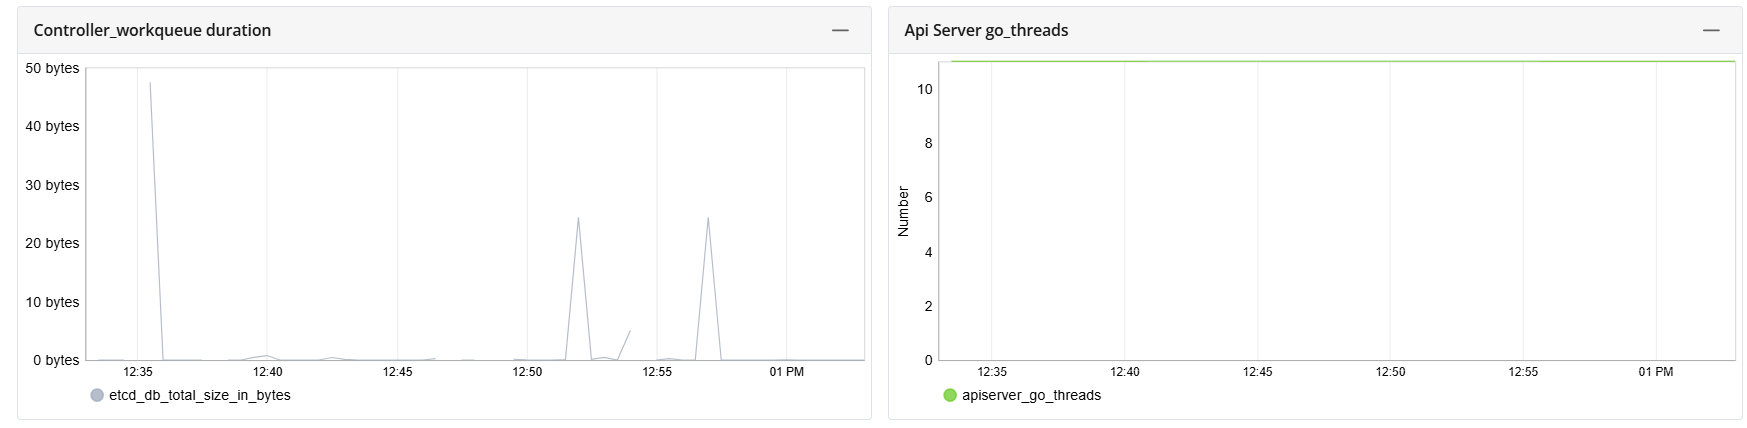
Controller Workqueue Duration and API Server Go Threads: Displays graphically the the time taken for the controller work queue to process items and a constant value of threads throughout the observed period.
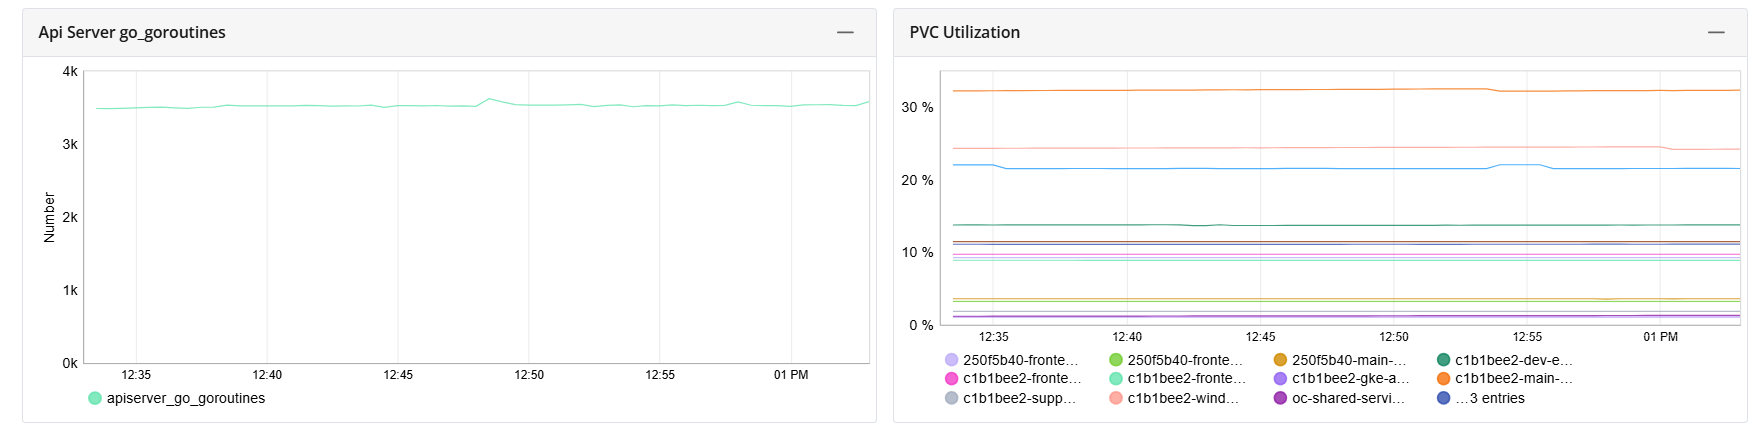
API Server Go Goroutines and PVC Utilization: Displays graphically the number of active Goroutines (lightweight threads in Go) and the percentage of storage used on Persistent Volume Claims.
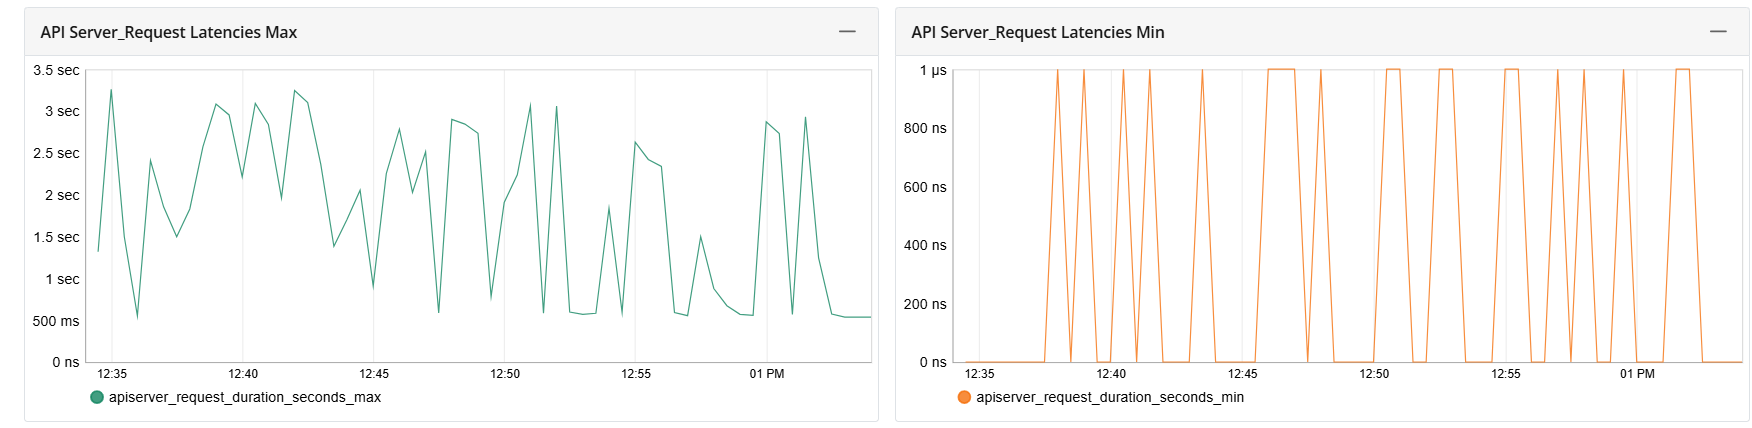
API Server Request Latencies Max and API Server Request Latencies Min: Displays graphically the maximum request latency (in seconds) and the minimum request latency (in nanoseconds/microseconds).
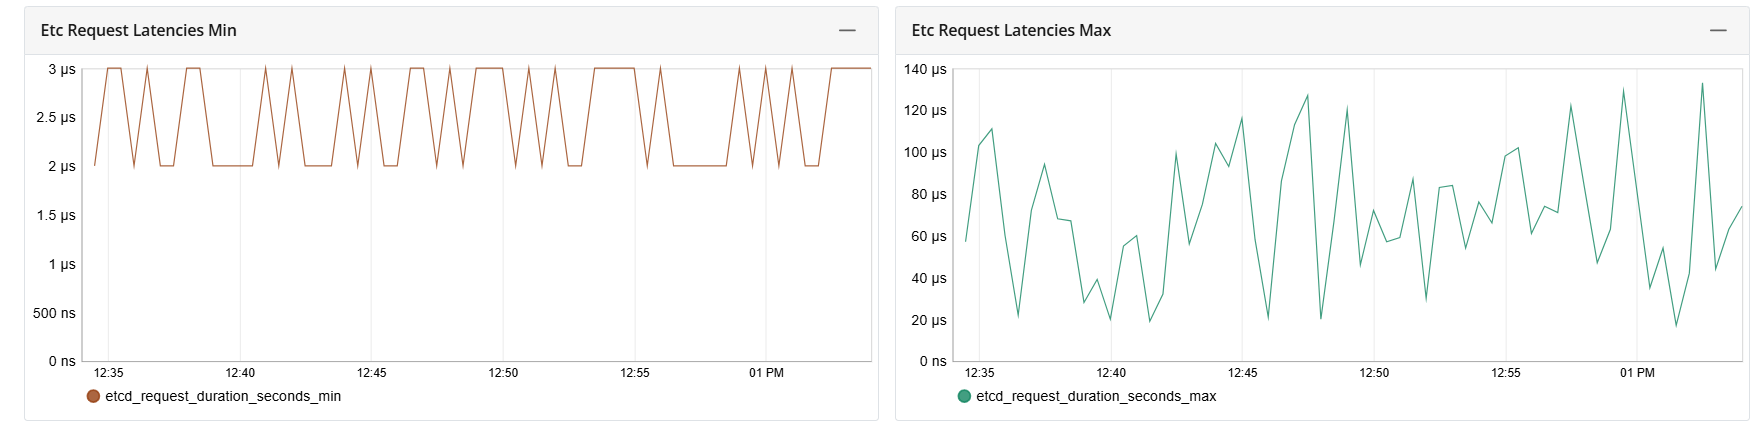
Etc Request Latencies Min and Etc Request Latencies Max: Displays graphically the minimum and maximum latency (in microseconds).
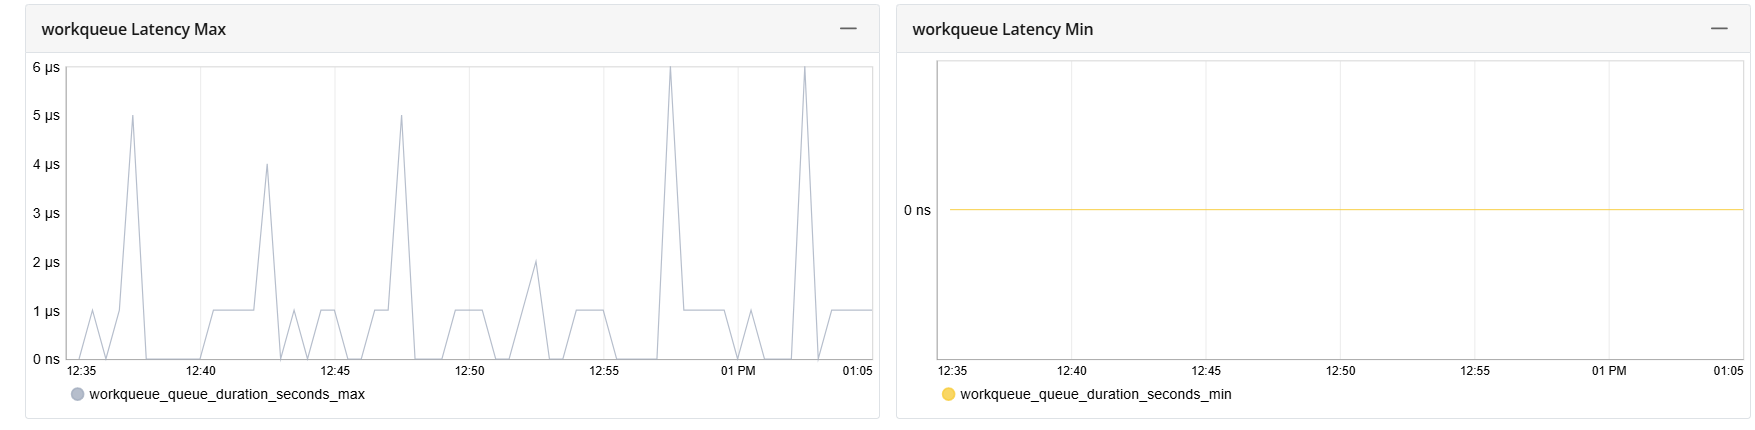
Workqueue Latency Max and Workqueue Latency Min: Displays graphically the maximum latency in microseconds (µs) and minimum latency in nanoseconds (ns).