Tabs in the Alert Page
Alert Overview page
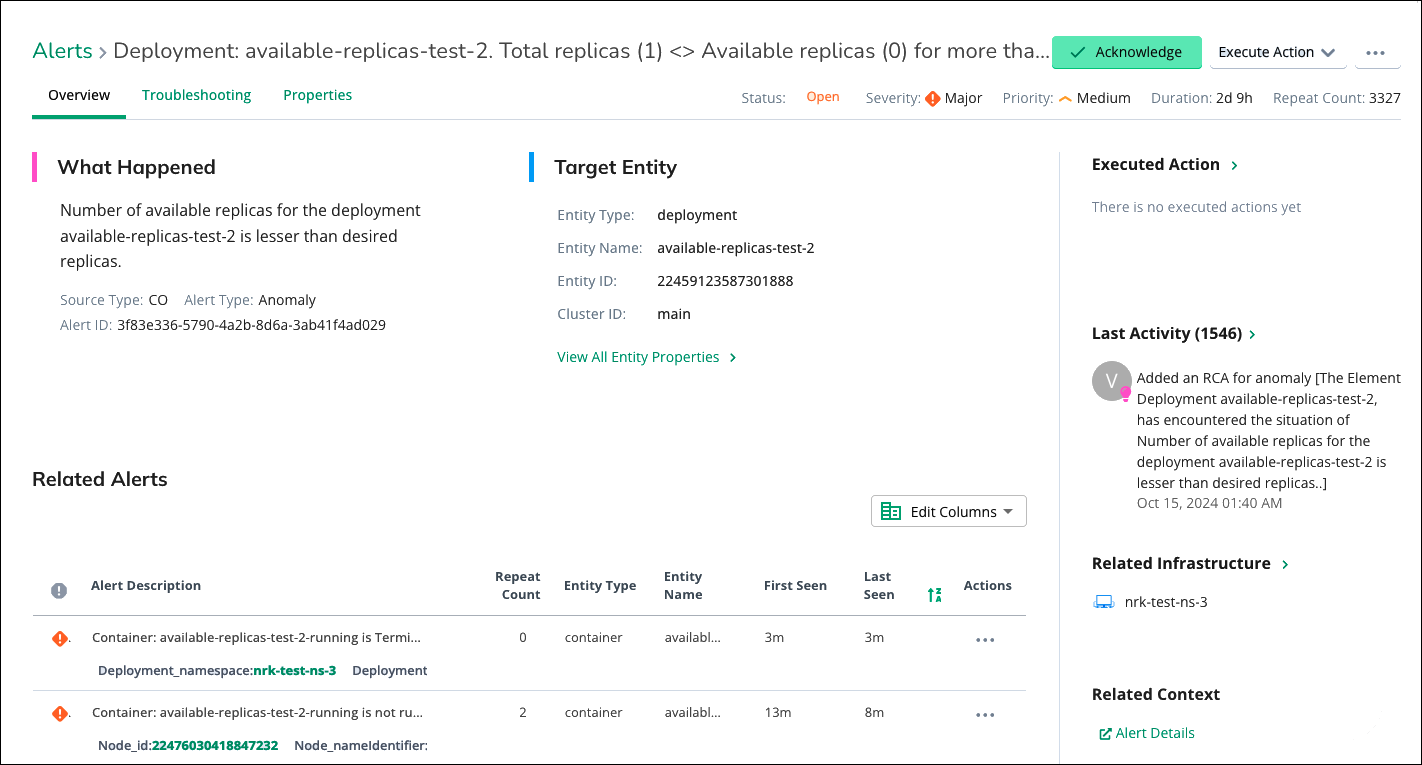
The Overview tab on the Alert Summary Page provides essential details about the alert, including what occurred, who manages the alert, unique identifiers, and specifics about the target entity associated with the alert.
To access the Overview tab, navigate to the Alert Summary Page by clicking on an alert from the alert list. Once on the Alert Summary Page, locate and click on the Overview tab to view the alert overview.

In the Overview tab, you can view the following details about the alert and its associated target entity:
What Happened: This section provides a brief description or summary of the event or condition that triggered the alert.
Components
Description
Source Type
Indicates the system or tool responsible for managing and generating the alert. This helps identify the source of the alert and the associated management system.
Alert ID
A unique identifier assigned to the alert, which can be used for tracking, referencing, and correlating related events or actions.
Target Entity Details
Components
Description
Entity Name
The name or label of the target entity associated with the alert provides context about the affected component or resource.
Entity Type
Indicates the type or category of the target entity, such as server, application, or network device.
Entity ID
A unique identifier assigned to the target entity, facilitating traceability and correlation with other system components.
Cluster ID
If applicable, this represents the identifier of the cluster or group to which the target entity belongs.
View All Entity Properties
Additional information or attributes related to the target entity, such as its configuration, status, or relationships with other entities.
Last Activity: The Last Activity section in the Global View alert management system provides users with valuable insights into the recent actions taken on alerts.
Last 20 Activities
The Last Activity section categorizes activities based on their nature and origin, employing color-coded indicators for easy identification:
Orange: Activities executed by automated systems or assistants are highlighted in orange.
Blue: Actions performed by human users are denoted in blue, indicating manual intervention or response.
In addition to viewing activity details, users have the option to add notes to the alert, providing additional context, observations, or instructions for future reference.
Important Activities Timeline
If the number of alert activities exceeds 2000, only the last 20 activities are displayed on the timeline.
If the count is greater than 100 and less than 2000, the first 5 and last 5 activities will be shown.
If the activity count is less than 100 or equal to, all activities will be displayed.
Additionally, if the alert substatus is Auto RCA, the alert details section is skipped.
Related Infrastructure Details: Alert also offers valuable details about the related infrastructure components. By displaying information about the node, pod, namespace, and container associated with the alert, users can gain a deeper understanding of the alert context and expedite incident resolution within the Global View platform.
Alerted Metrics: The Alerted Metrics Graph is a visual representation of the metrics associated with an alert within the Global View platform. This graph allows users to view detailed data over time, providing insights into the performance, behaviour, or status of the monitored system or application. The Alerted Metrics Graph presents the following details:
Metric Data: The graph displays the specific metric(s) that triggered the alert.
Time Axis: The x-axis represents time, with data points plotted over a specified time range.
Percentage Scale: The y-axis typically represents the percentage or value of the metric being monitored.
Related alerts: Related alerts typically refer to a secondary alert that is connected or associated with a primary alert.
Alert Troubleshooting page
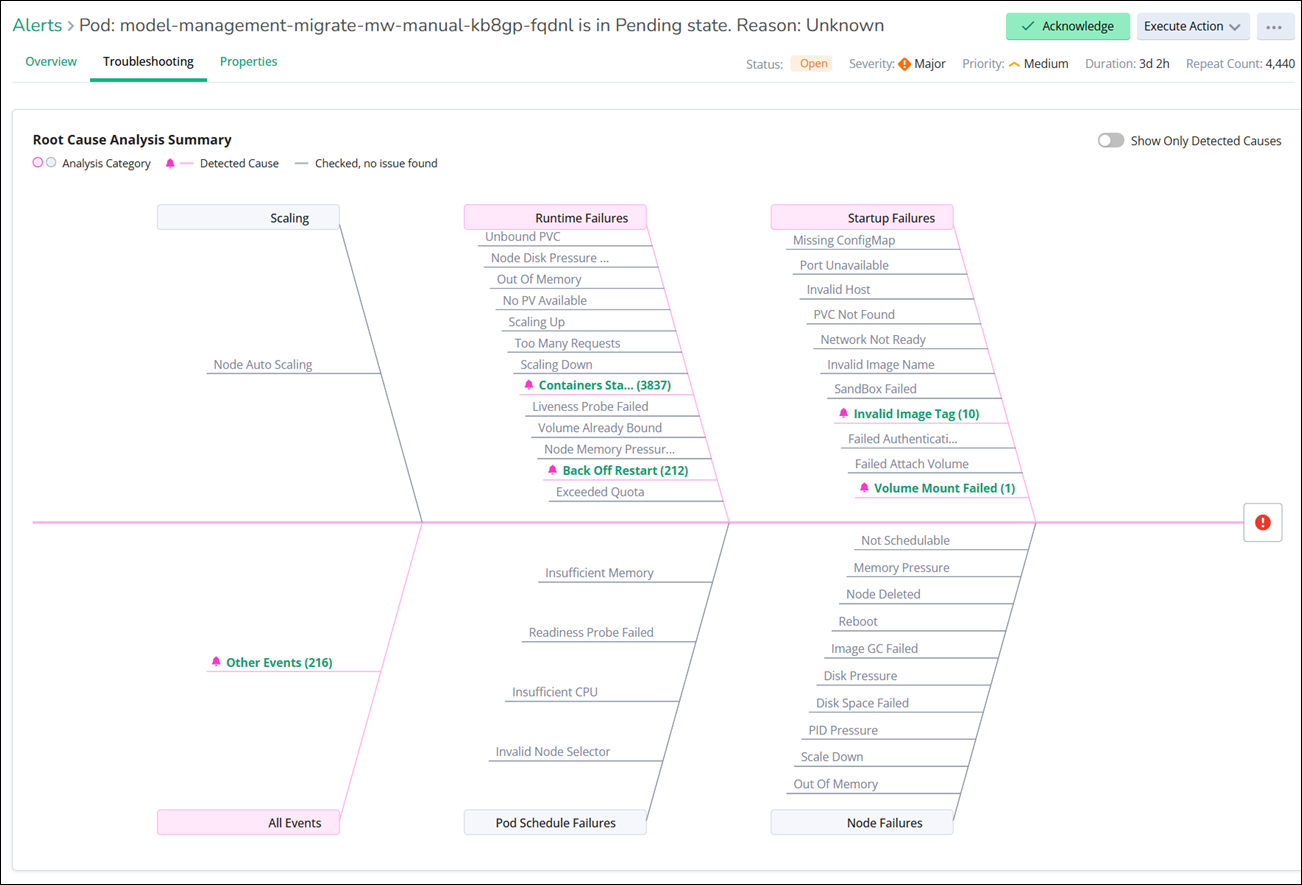
In this tab, you can drill down into entity failures and their detected causes to help you take action on this alert. Data to help you diagnose the issues is presented in the fishtail graph, which you can streamline to show just the detected causes. Click a detected cause to view more information.

This section provides a comprehensive overview of the alert investigation process, including pertinent details such as:
Root Cause Analysis Summary: Root cause analysis (RCA) in AIOps (Artificial Intelligence for IT Operations) is the process of identifying issues within an IT infrastructure. A fishbone diagram is used to identify and analyze the potential causes contributing to a problem.
Icon
Description

Analysis Category: This categorizes the nature of the issue, providing insights into whether it's related to performance, connectivity, security, or other relevant areas.

Detected Cause: This section outlines the specific cause or causes identified during the analysis process.

Checked, No Issue Found: If no underlying issue is detected during the troubleshooting process, this status will be indicated. It suggests that the alert may have been triggered by transient factors or false positives.
Show Only Detected Causes button: By enabling this button, you will exclusively see details about the detected causes, providing a clear and concise overview of the underlying issues driving the alert.
Detected Cause Details: This displays a comprehensive breakdown of potential causes. Each detected cause is listed along with relevant details. Clicking on an individual detected cause reveals further information. You have the option to view metric data related to the selected cause. This includes graphical representations of metrics.
Note
In IM troubleshooting, only recommendations and root cause details are presented, whereas in AM, both the RCA and its associated details are displayed.
Note
The Troubleshooting tab is accessible specifically for alerts marked with an insights icon.
Alert Properties page
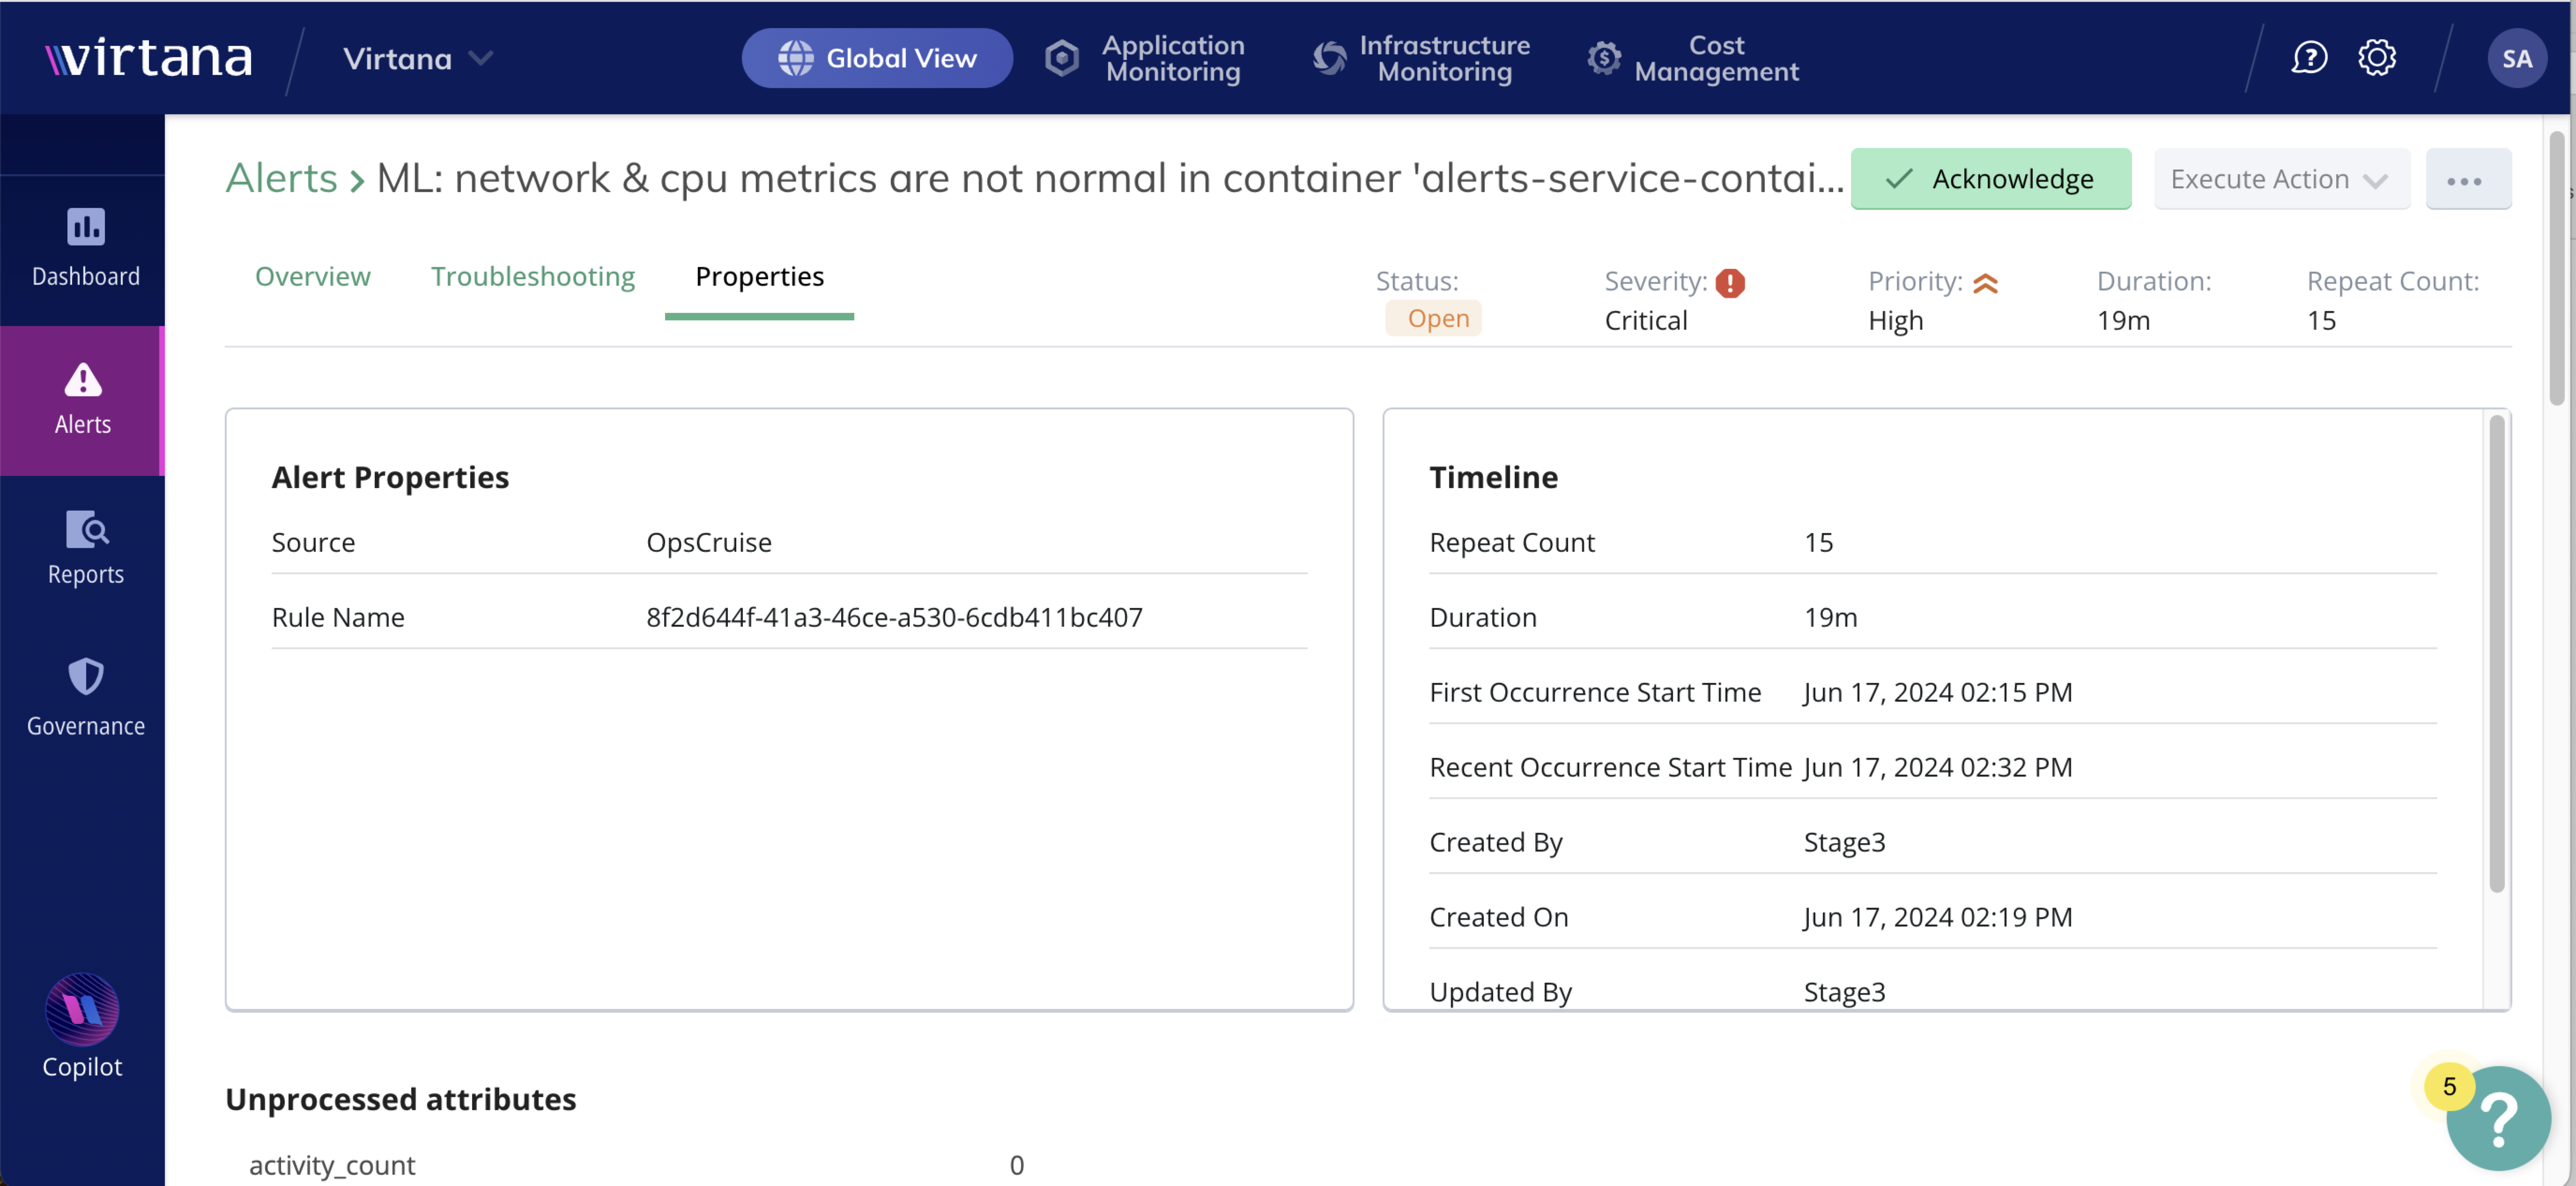
In Global View, alert properties play a crucial role in providing detailed information about an alert. The properties typically encompass various aspects, like alert properties, such as metric name, rule identification, alert name, entity properties, and many more details, with additional data details. You can view:

Alert properties: The Alert Properties tab provides information about the alert itself, including:
Components
Description
Source
This field indicates the origin or subsystem that generated the alert.
Rule Name
This field shows the specific rule or policy that triggered the alert.
Alert timeline: You can view the alert’s occurrence history and lifecycle events that include:
Components
Description
Repeat Count
This indicates the number of times this alert condition has occurred.
Duration
This represents the total duration for which the alert condition has persisted.
First Occurrence Start Time
This is the timeline when the alert was first triggered.
Recent Occurrence Start Time
This is the timeline of the most recent occurrence of the alert.
Created By
This indicates the user or system component that created the alert.
Created On
This is the timestamp when the alert record was created.
Updated By
This shows who last updated the alert.
Updated On
This is the timestamp of the most recent update to the alert record.
Unprocessed Attributes: This tab displays all raw, unmapped, or custom attributes received with the alert that are not directly mapped to standard Virtana alert fields. It is especially useful for troubleshooting integrations, reviewing custom payloads, and ensuring no incoming data is lost during alert processing.