Exporting a Chart or a Report
You can export a chart from as a PNG, JPG, PDF, SVG, or CSV file. Data can also be exported to the local clipboard. This is useful for including in documents or in another report in .
Note
When data are exported to CSV, values listed as percentages (e.g., 50%) will be exported as decimal numbers (e.g. 0.5).
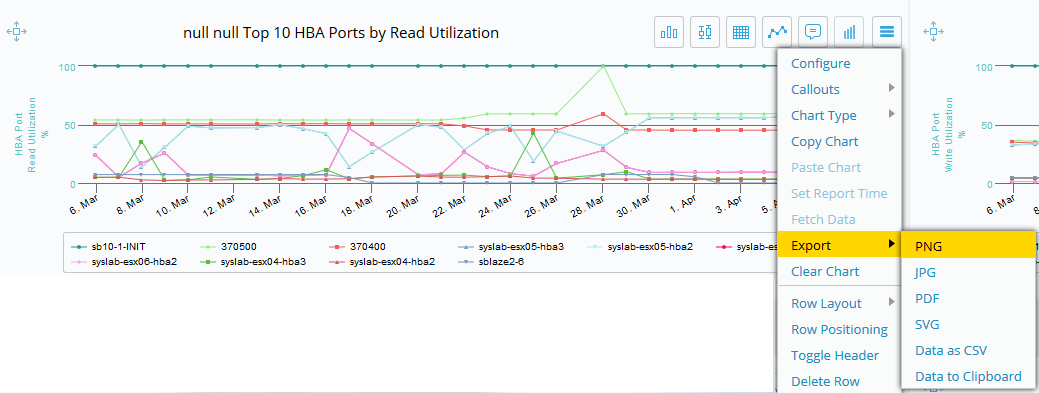
To export a chart, select the hamburger icon, then Export and choose the export file format.
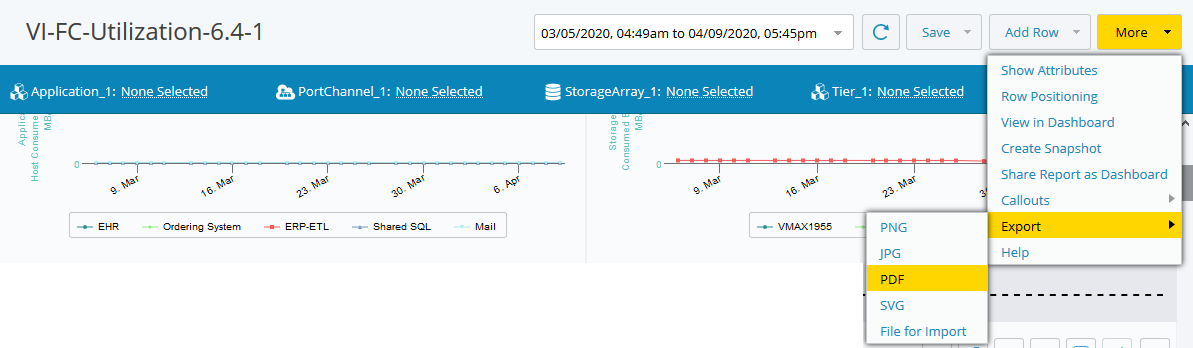
You can also export the entire report as an image file or a PDF file. Click the More button, then select Export and choose the export file format.