Custom Dashboards
In the Custom dashboard in Global View, you can build tailored, multi‑source dashboards that combine metrics, alerts, anomalies, business signals, and environmental data into a single, shareable view. You can design dashboards for different audiences, such as executives, SREs, or capacity planners, by selecting exactly which tiles to show and how they are laid out.
Note
Custom Dashboards is available for SaaS deployments only. It isn't currently supported for on-premises installations.
To access custom dashboards from within Global View, navigate to the Dashboards > Custom Dashboards.
Viewing a custom dashboard
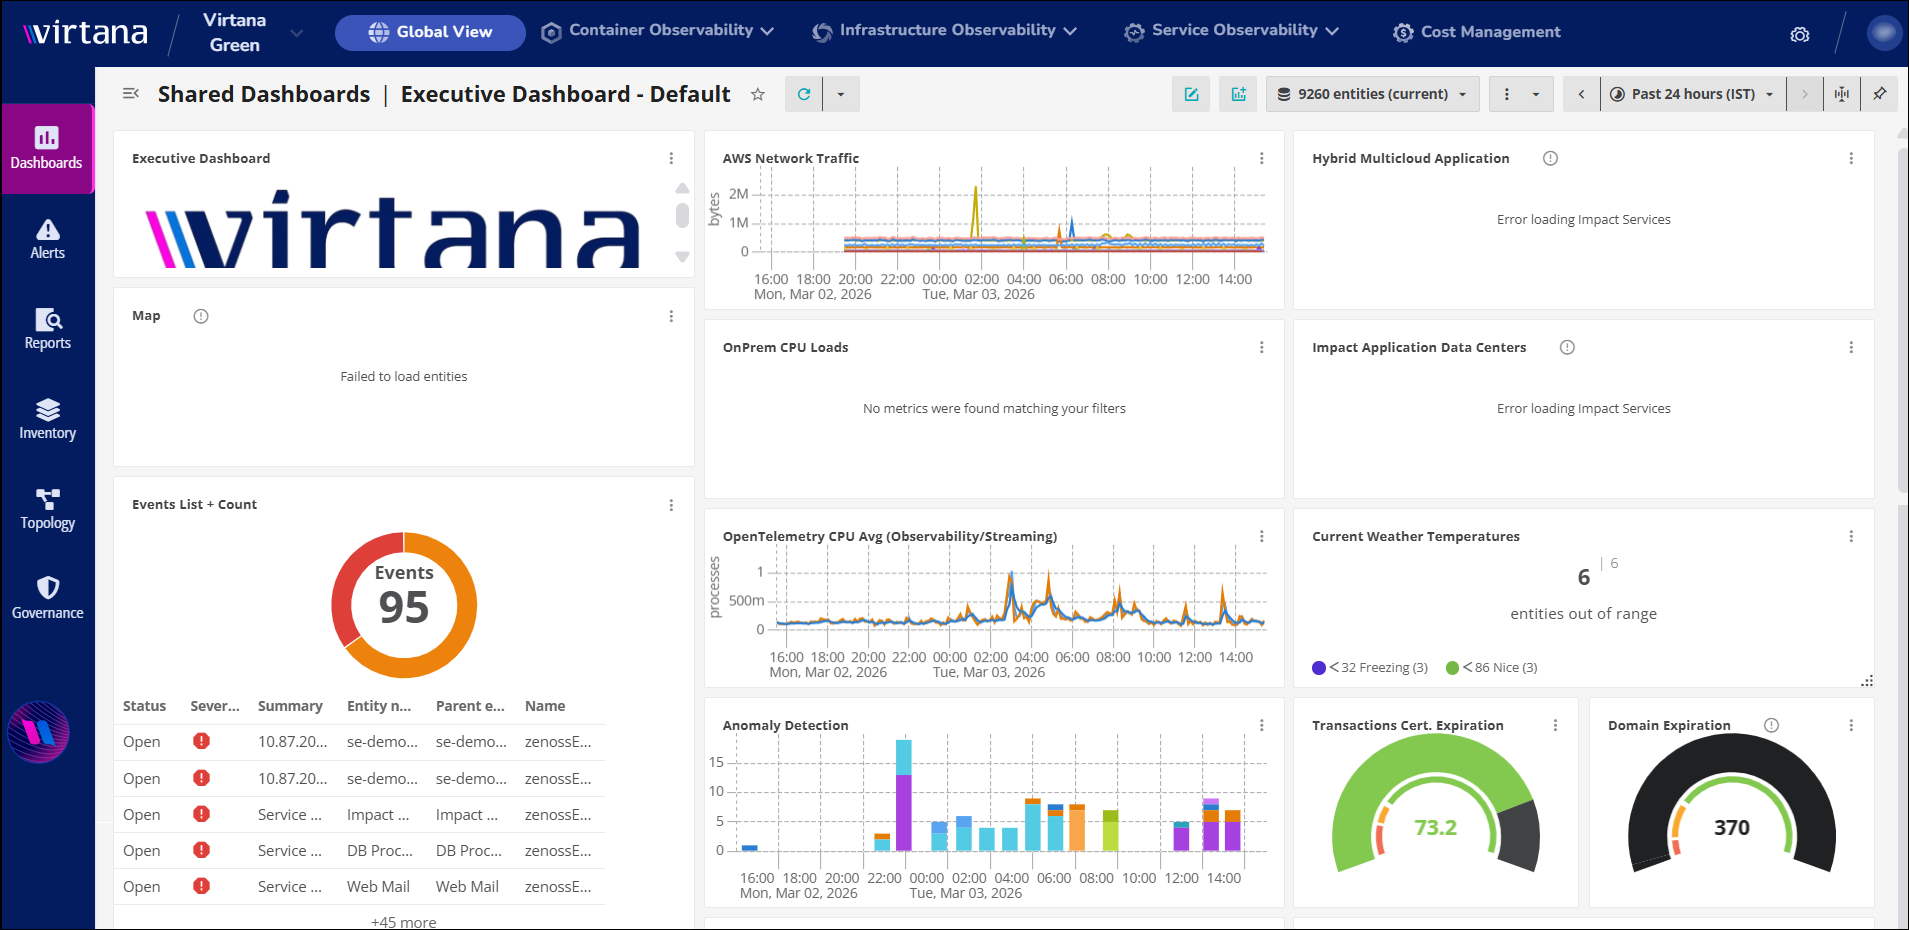
A custom dashboard uses a flexible grid layout made up of tiles.

Number | Component | Description |
|---|---|---|
1 | Dashboard selection | To create a customized dashboard, you can access this section. You can also view the list of customized dashboards you have created. |
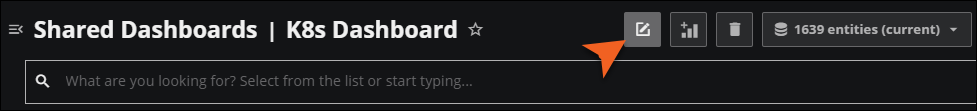
2 | Dashboard name (editable) | The dashboard name is assigned while creating the dashboard. It can also be edited according to your requirements. Select the star to categorize the dashboard in favorites. |
3 | Refresh options | Use this control to refresh the dashboard data on demand or configure an automatic refresh interval. When you click Refresh options, the Dashboard Auto Refresh box opens. You can activate the auto refresh option and enter a refresh interval. Options include 1, 3, 5, and 10 minutes. |
4 | Expand scope filter bar | Click to open a query builder, then create queries to refine the entities that you want to see. As you enter text, the scope filter bar suggests options for each part of the query, including property names, operators, values, and connectors. |
5 | Add tile | A tile is a single, self‑contained visualization or data panel on the dashboard grid. Each tile represents one configured view of data. Click to open the AVAILABLE TILES panel, then click a tile to add to your dashboard. When you add a tile, the Tile configuration page opens. Each tile type has specific configuration settings and other options. To learn more about configuring a specific tile type, see the Adding tiles to your dashboard. |
6 | More action options | Provides additional dashboard‑level actions, such as exporting or sharing it, full-screen mode, and a delete option. You can able to export the dashboard in CSV, JSON, or PDF formats. |
7 | Time range panel expand option | Expands or collapses the time range panel. When expanded, you can change the time range (for example, Last 1 hour, Last 10 hours, custom range) used by dashboard tiles. |
8 | Save time range | Saves the currently selected time range as the default for this dashboard. When you open the dashboard later, it loads with the saved time range unless you manually override it. |
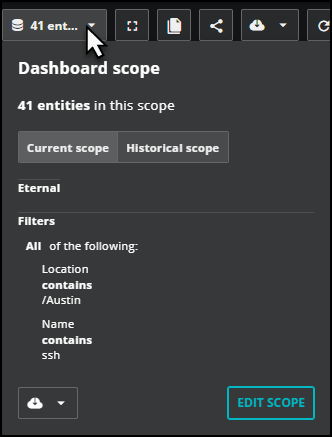
9 | Scope | Displays a description of the scope of entities in the dashboard. Click to open the Dashboard scope panel, where you can switch between current and historical and edit the scope. See Defining dashboard scope. |
Viewing each tile
You can view each tile on a Custom dashboard as an independent, data‑backed view into a specific aspect of the environment. You can move and resize each tile on your dashboard, as well as perform other actions.
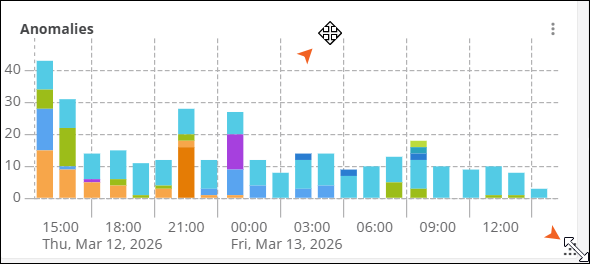
To move a tile to another location, hover your mouse over the tile header. When the mouse changes to the compass, you can click to grab the tile and move it to a different location. The tile actions appear when you move your mouse anywhere over a tile.
To resize a tile, hover your mouse in the tile footer. When the resize icon appears in the bottom-right corner, click it to adjust the tile size.
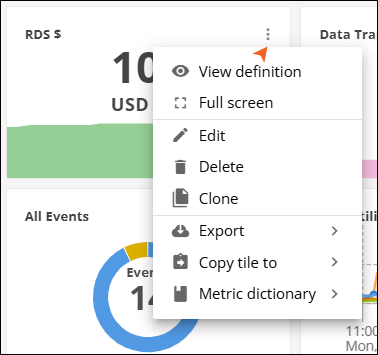
To view the menu options of each tile, click (⋮) on the tile. You can view the following options in the menu:
Options | Description |
|---|---|
View definition | From here, you can see which metric(s), aggregations, filters, entities, and visualization settings the tile uses. |
Full screen | In full‑screen mode, the tile keeps the same data and interactions but gives you more space to inspect fine‑grained detail. |
Edit | Using the edit option, you can edit the tile configuration. |
Delete | Removes the tile from the current dashboard layout. This operation affects only the dashboard you are editing; it does not delete the underlying metrics or entities. |
Clone | Creates a new tile based on the current tile’s definition. The cloned tile starts with the same metric, filters, and visualization settings, but can be independently edited and re-positioned. |
Export | This option includes exporting the chart as an image or downloading the underlying data in CSV, JSON, or PDF formats. |
Copy tile to | You can copy the tile with the same configuration to another dashboard. |
Metric dictionary | Links the tile to entries in the Metric Dictionary. From here, you can look up detailed documentation for the metric(s) used by the tile. |
Defining dashboard scope
You can define the dashboard scope in several ways. You can define the set of entities a dashboard includes, apply additional filters to that scope, and choose a scope type for the dashboard.
Set dashboard scope type
You can choose current or historical scope for a dashboard.
Display a dashboard that you own.
Open the Dashboard scope panel by clicking the scope control.
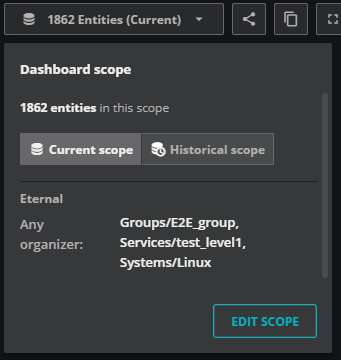
Click Current scope or Historical scope.
To close, click outside the panel.
Edit the dashboard scope
You can edit the scope of your dashboard. This is useful when you want to adjust the entities included in your current scope or if you want to modify or delete filters you have applied.
In your dashboard, open the Dashboard Scope panel by clicking the scope control.
Click EDIT SCOPE. The Define Dashboard Scope page opens.
Add, modify, or delete the entities and filters in the current queries. Be sure to save in each section as you make your changes.
Click SAVE to return to the dashboard.
For more information about defining the dashboard scope, including using a query to define entities, see Create a new custom dashboard.
Filter the dashboard scope
You can further refine the scope of your dashboard using the scope filter to help you in your investigations. For example, you might have a dashboard monitoring 10,000 devices, and you receive an error on device "X". To reduce the scope of your dashboard, open the scope filter bar and build a query, such as "name contains X".
The Expand scope filter bar opens the query builder where you can specify the criteria of the entities you want to view. As you enter text, the scope filter bar suggests options for each part of the query, including property names, operators, values, and connectors. If needed, use the autocomplete dropdowns to change a part of the query.
To keep this filter as part of your dashboard scope, click the Save icon in the query bar. When you save this filter, you can view it as part of the Dashboard scope. Select the scope control to view the scope and its filters.
To create a filter for your dashboard:
Display a dashboard that you own.
Click Expand scope filter bar to open a query builder.
Select a property. Enter text and select a field in the dropdown menu.
Select an operator in the dropdown menu, then enter a value.
Optionally, build a more targeted query. Choose between AND and OR to join another property-value comparison. The dashboard displays data matching the filtered scope.
When you're finished viewing the refined dashboard, click the Save icon in the query bar to keep this filter as part of your dashboard scope, or click the X icon to clear the scope filter bar and return to the dashboard scope.
Note
When you save the scope filter, you can view it in the Dashboard scope panel. If you want to edit or remove the filter for this dashboard, click EDIT SCOPE in the Dashboard scope panel.
Click the scope filter button again to collapse the query bar.
Note
When you collapse the scope filter, you hide the query bar. However, any applied filters remain active until you clear the query bar by clicking the X icon. Alternatively, you can navigate away from the dashboard to clear its scope filters.
In addition to setting filters for the dashboard scope, you can also set filters on select tile types. Learn more.
Manage Custom dashboards
The Dashboards page lets you view, organize, and create dashboards that help you monitor operational or business metrics. You can work with dashboards that you create, dashboards shared by other users, and built-in templates provided by Virtana Platform.
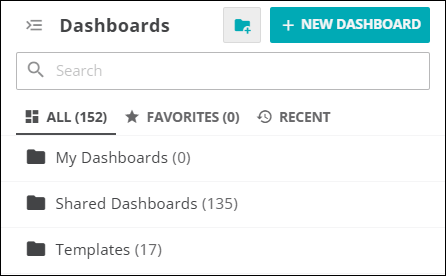
The page includes the following components to help you find dashboards quickly:
Components | Description |
|---|---|
Search bar | You can find dashboards by name. |
All | You can view the list of all the dashboards available for your organization. |
Favorites | Here you can view the list of dashboards you star-marked as favorites. |
Recent | The most recent dashboard list that you have visited. |
Add new folders | You can add new folders in any tab as per the requirement. |
Create a new dashboard | You can create a new dashboard to customize a board as per your requirements. |
Create a new custom dashboard
Create a new dashboard when you need a customized view that is not available in the existing dashboards.
Perform the following steps to create a new dashboard:
In Global View, navigate to the Dashboards > Custom Dashboards.
In the top menu bar, click the Dashboard selection (
 ) button.
The Dashboards page opens.
In the Dashboards page, click New Dashboard.
You can view the Define Dashboard Scope page. In the top left corner, you can edit the name of the dashboard on this page.
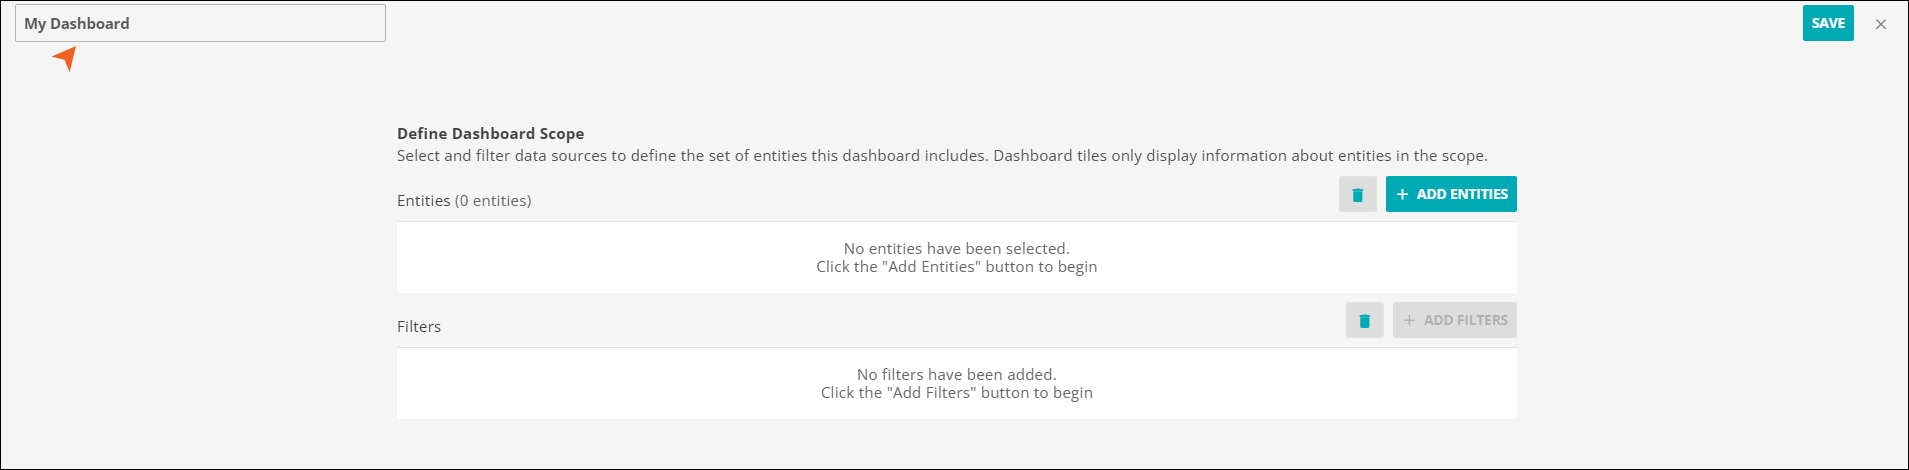
To add a source, click Add Entities.
You can view the available source in the Virtana Platform.
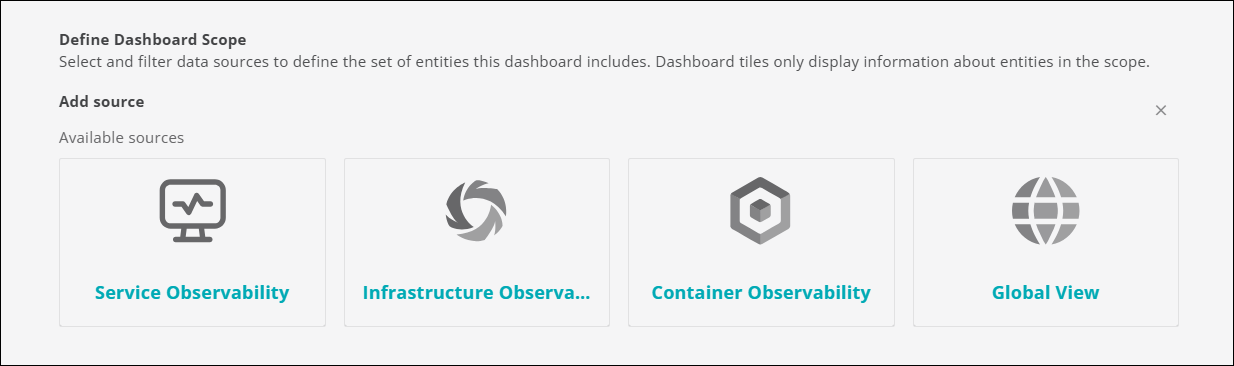
Select any source, for example, Global View.
This task enables the filters option.
Tip
You can select multiple sources at once.
Click Add Filters.
You can add multiple filters, configure filter limit values as required, and click Save Filter.
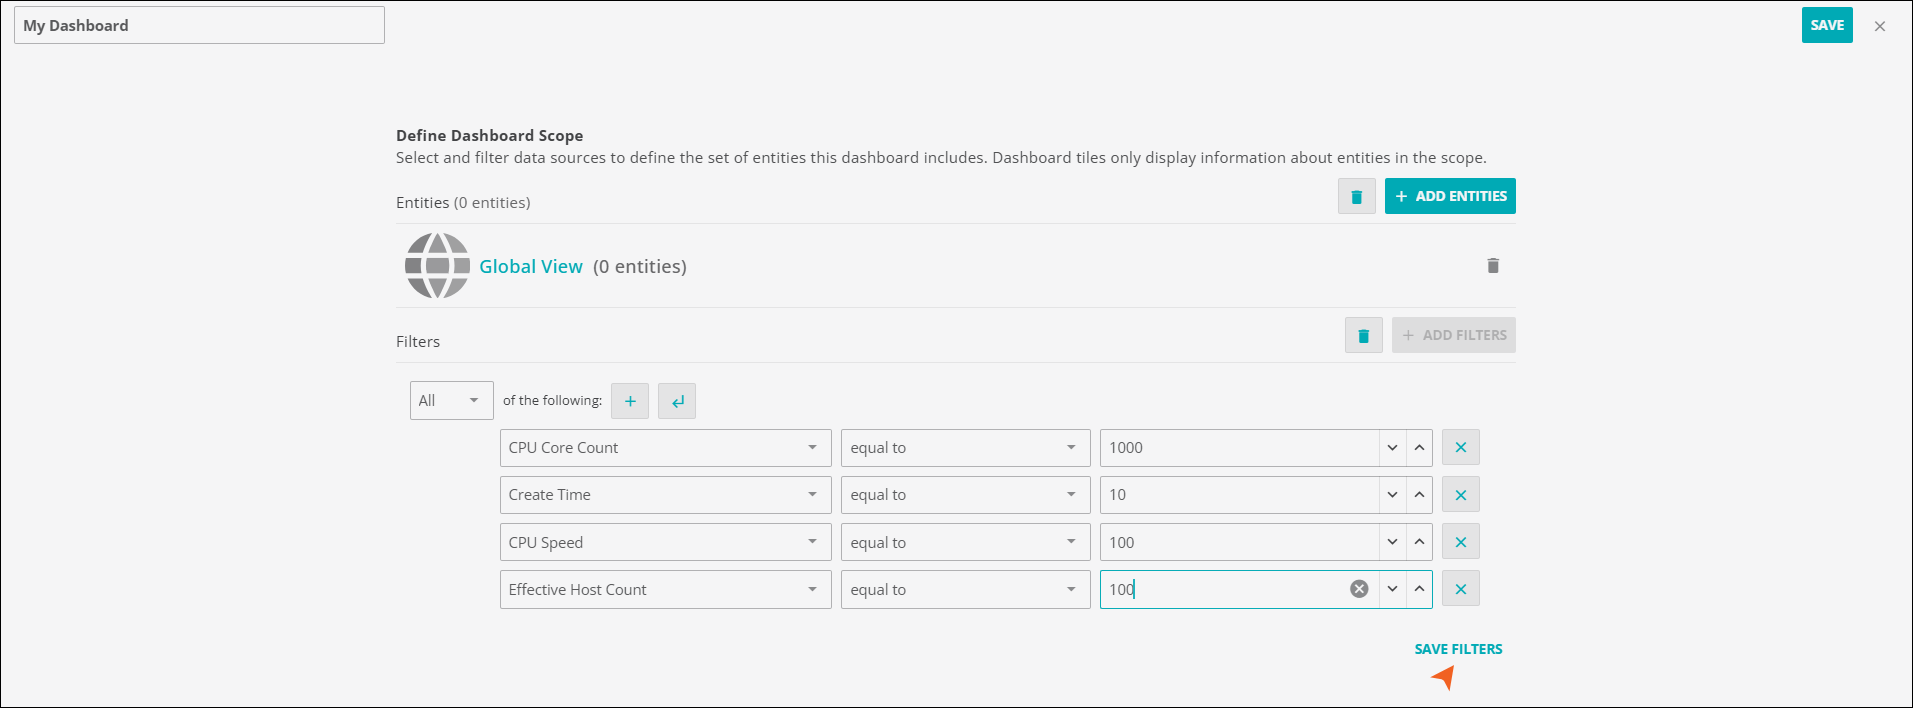
Review your selection and click Save.
The dashboard is created with a custom name. You can view your dashboard in the My Dashboards folder.
Adding tiles to your dashboard
After you create your dashboard and define its scope, you are ready to return to Dashboards to add tiles. This task assumes you are in DASHBOARDS.
Click the add tile control or ADD A TILE.
In the AVAILABLE TILES palette, click a tile to add it to the dashboard.
When you add a tile, the AVAILABLE TILES palette becomes the TILE CONFIGURATION dialog box. For more information about configuring individual tiles, see the following pages:
Note
For optimal performance, Virtana recommends limiting dashboards to 4-6 tiles per page and 2 pages per dashboard.
Click SAVE.