Virtana Service Observability agent on Windows
You can install and configure the About Streaming data to collect data from your Windows hosts and stream it directly to Virtana Service Observability. You can use the non-interactive installation method so you can easily automate its distribution to hosts throughout your environment.
After installation, you can configure and manage the Virtana Service Observability agent and collect metrics for your Windows hosts.
Installation process
During the non-interactive installation of the data monitor agent, the installer is supplied with a text file containing variables and parameter values that provide answers to the installer prompts, including the license agreement.
The non-interactive installation process includes the following tasks:
Before you begin
Before you begin installing the Virtana Service Observability agent on Windows, be sure that you meet the following requirements.
To install and manage the Virtana Service Observability agent, you will need to meet the following hardware requirements:
1 CPU core (64-bit)
30 MiB main memory
A network interface that supports TCP/IP and provides a minimum of 5 Mbps (megabits per second) upload capacity
To install and manage the Virtana Service Observability agent on Windows, you will need to meet the following software requirements:
Windows Server 2016 or later
A Windows login account with Administrator privileges
Internet access with outbound TCP traffic through port 443
DNS support, so you can reach your Virtana Service Observability API endpoint
To support Virtana tools, you will need to meet the following requirements:
Permission to download files at delivery.zenoss.io. You can contact the Virtana Support site to request this permission.
A Virtana Service Observability API authentication key.
Download the distribution file
Perform the following steps to download the distribution file for the data monitor agent.
In a web browser, go to delivery.zenoss.io and log in to the Virtana Support Portal.
In Virtana Delivery, locate Collector 2.0 and click View/Hide to view the available files for download.
Download the latest file for Windows systems. For example, download the
zendatamon-agent_1.0.0_build113.msifile. Note that the version number or build number might be different.If necessary, copy the file to the Virtana Service Observability agent host.
Install the Virtana Service Observability agent on Windows
Non-interactive installation
Perform the following steps to install (non-interactively) the data monitor agent.
Note
This procedure assumes you are using a PowerShell window ($VAR="value"). Adjust as needed for Command Prompt windows (set VAR="value").
Log in to the Windows host as a user with Administrator privileges.
Run PowerShell as Administrator, and then change directory to the directory where you saved the
zendatamon.msifile.Set a temporary variable for your Virtana Service Observability API endpoint and port, which is always 443.
Replace
<YOUR_API_ENDPOINT>with your endpoint:$myEndpoint="<YOUR_API_ENDPOINT>:443"
Set a temporary variable for a Virtana Service Observability API authentication key.
Replace
<YOUR_API_KEY>with an API key:$myApiKey="<YOUR_API_KEY>"
(Optional) Set a temporary variable for a source name for this service.
The default value is
{hostname}.windows-agent, where{hostname}is replaced with the host's name. You can specify{ipaddr}in the source name to get the host's IP address. As a best practice, append.windows-agentto the source name.Replace
<YOUR_SOURCE_NAME>with a source name for this service:$mySource="<YOUR_SOURCE_NAME>"
(Optional) Set a temporary variable for an alternate installation directory.
The default directory is
C:\Program Files (x86)\Zenoss. Replace<YOUR_INSTALL_DIR>with an absolute path:$myInstall="<YOUR_INSTALL_DIR>"
Review the license agreement for the Virtana Service Observability Agent Software.
Start the installation using one of the following commands, depending on your optional variables.
No options
```shell
.\zendatamon.msi ZENOSS_LICENSE_AGREEMENT="yes" ZENOSS_API_ENDPOINT="$myEndpoint" ZENOSS_API_KEY="$myApiKey"
Source name option
```shell
.\zendatamon.msi ZENOSS_LICENSE_AGREEMENT="yes" ZENOSS_API_ENDPOINT="$myEndpoint" ZENOSS_API_KEY="$myApiKey" ZENOSS_SOURCE="$mySource"
Install directory option
```shell
.\zendatamon.msi ZENOSS_LICENSE_AGREEMENT="yes" ZENOSS_API_ENDPOINT="$myEndpoint" ZENOSS_API_KEY="$myApiKey" ZENOSS_INSTALL_DIR="$myInstall"
````
Both options
```shell
.\zendatamon.msi ZENOSS_LICENSE_AGREEMENT="yes" ZENOSS_API_ENDPOINT="$myEndpoint" ZENOSS_API_KEY="$myApiKey" ZENOSS_SOURCE="$mySource" ZENOSS_INSTALL_DIR="$myInstall"
````
Managing the Virtana Service Observability agent on Windows
The Virtana Service Observability agent service has separate configuration files for itself and for the metrics and events it collects.
Manage the Virtana Service Observability agent service on Windows
Use Windows Services Manager to stop, pause, and restart the Virtana Service Observability agent service.
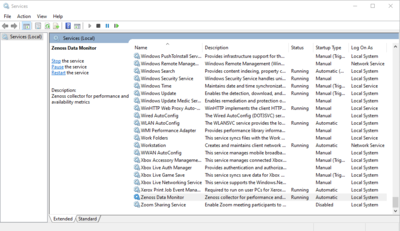
All of the user configuration properties in the configuration file for the Virtana Service Observability agent service are set when you install the service. The default path of the service configuration file is C:\Program Files (x86)\Zenoss\ZenDatamon\configs\agent.yaml. The Virtana Service Observability agent service loads changes in the configuration file immediately.
In the following example file, the values that start with _ZDM_SEC_ are defined in the alternate.xml text file in the same directory.
yaml title="agent.yaml" apiVersion: v1 agent: name: win.svc.zdmagent source: _ZDM_SEC_<ALT_SOURCE> defaultInterval: 60s datasinks: - name: zenoss-stream type: zenoss conf: address: _ZDM_SEC_<ALT_ADDRESS> apiKey: _ZDM_SEC_<ALT_APIKEY> logOnly: false configurationSource: local: - name: localds directory: configs/datasources secretlookup: type: alternate
Manage the Virtana Service Observability agent metrics on Windows
The configuration file for the Windows datasource controls which metrics are collected. The default path of the file is C:\Program Files (x86)\Zenoss\ZenDatamon\configs\datasources\localhost.yaml.
The following is an example file:
yaml title="localhost.yaml" apiVersion: v1 kind: datasource name: localhost spec: type: localhost datasource: #disableSys: true #disableNet: true #disableMem: true #disableCPU: true #disableDisk: true #disableDiskIO: true filters: # All metrics metricPass: - "*"
To deactivate collection for a group of metrics, you can remove the comment character (#) in the metric group. By default, all metrics are collected. In the following table, you can view the properties in the localhost.yaml file paired with specific metrics:
Manage the Virtana Service Observability agent events on Windows
The Virtana Service Observability agent gathers events from the Windows Event log using the settings in its events configuration file. The default path of the file is C:\Program Files (x86)\Zenoss\ZenDatamon\configs\datasources\winevents.yaml. The Virtana Service Observability agent service loads changes in the configuration file immediately.
Windows metrics
View the metrics for Windows in the following tables. Windows metrics include system, CPU, memory, disk, disk I/O, and network.
System metrics
Name | Units | Description |
|---|---|---|
| cycles | The collective time the system used during boot |
| count | A count of CPU cores |
| processes | The load average over the past 1 min on the system |
| processes | The load average over the past 5 mins on the system |
| processes | The load average over the past 15 mins on the system |
| count | The count of running processes |
| count | The count of current users |
| time | A monotonically incrementing metric for system up time |
CPU metrics
Name | Units | Description |
|---|---|---|
| cycles | A monotonically incrementing metric for CPU activity |
| cycles | A monotonically incrementing metric for CPU idleness |
| cycles | A monotonically incrementing metric for CPU guest activity |
| cycles | A monotonically incrementing metric for CPU guest nice activity |
| cycles | A monotonically incrementing metric for CPU IO Waiting activity |
| cycles | A monotonically incrementing metric for CPU IRQ activity |
| cycles | A monotonically incrementing metric for CPU Nice activity |
| cycles | A monotonically incrementing metric for CPU Soft IRQ activity |
| cycles | A monotonically incrementing metric for CPU Steal activity |
| cycles | A monotonically incrementing metric for CPU System activity |
| cycles | A monotonically incrementing metric for CPU User activity |
| percent | Percent of CPU used for activity |
| percent | Percent of CPU used for idleness |
| percent | Percent of CPU used for guest activity |
| percent | Percent of CPU used for guest nice activity |
| percent | Percent of CPU used for IO Waiting activity |
| percent | Percent of CPU used for IRQ activity |
| percent | Percent of CPU used for Nice activity |
| percent | Percent of CPU used for Soft IRQ activity |
| percent | Percent of CPU used for Steal activity |
| percent | Percent of CPU used for System activity |
| percent | Percent of CPU used for User activity |
† Some releases of Windows do not collect this metric, so the value may be empty. |
Memory metrics
Name | Units | Description |
|---|---|---|
| GB | The total amount of memory for the system |
| GB | The amount of free memory for the system |
| GB | The amount of used memory |
| percent | The percent of memory used |
| GB | The amount of available memory |
| percent | The percent of memory available |
Disk metrics
Name | Units | Description |
|---|---|---|
| GB | Total capacity of the disk |
| GB | Used space on the disk |
| percent | Percent of the disk used |
| GB | Free space on the disk |
| percent | Percent of the disk free |
| count | Total INodes on the disk |
| count | Used INodes on the disk |
| count | Free INodes on the disk |
† Some releases of Windows do not collect this metric, so the value may be empty. |
Disk I/O metrics
Name | Units | Description |
|---|---|---|
| time | The time used for disk io operations |
| time | The time used for disk io operations weighed over a period |
| count | The number of IO operations in progress |
| count | The number of merged read operations |
| count | The number of merged write operations |
| bytes | The number of bytes read |
| time | The total time used for read operations |
| bytes | The number of bytes written |
| time | The total time used for write operations |
| count | The total number of read operations |
| count | The total number of write operations |
Network metrics
Name | Units | Description |
|---|---|---|
| kbps | The rate of bytes being sent |
| kbps | The rate of bytes being received |
| count | A monotonically incrementing metric for sent packets |
| count | A monotonically incrementing metric for received packets |
| count | Count of lost inbound packets |
| count | Count of lost outbound packets |
| count | Count of inbound packet errors |
| count | Count of outbound packet errors |