Viewing Performance Snapshot of a Host
This topic helps you to analyze the host metrics' health in terms of the node exporter collecting the node metrics and the process exporter collecting the process metrics in the VM.
The Performance Snapshot page describes the performance of the Host network and resource usage.
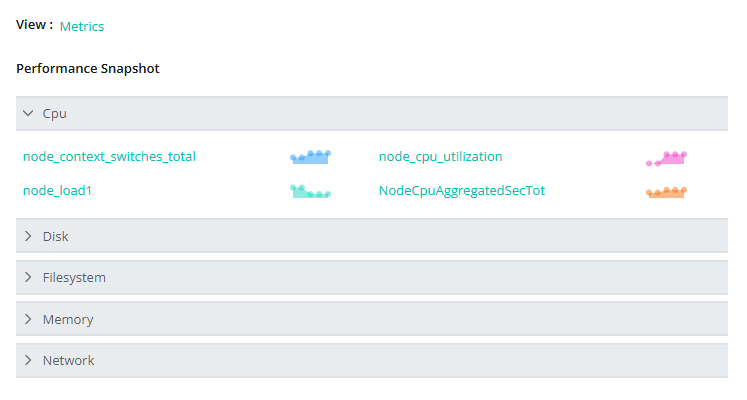 |
Performance Snapshot describes the resource usage, metrics health, and network performance of the host.
Click CPU to expand the CPU entities of the host.
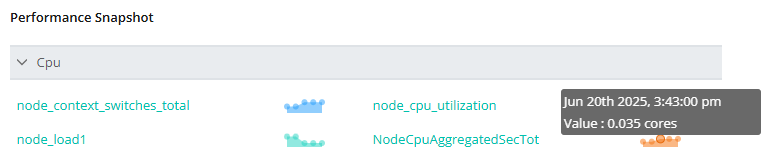
Hovering over an entity graph displays the amount of transmit/receive network and resource health in each time interval.
Click on any entity.
It will display the entity's threshold data for the host.
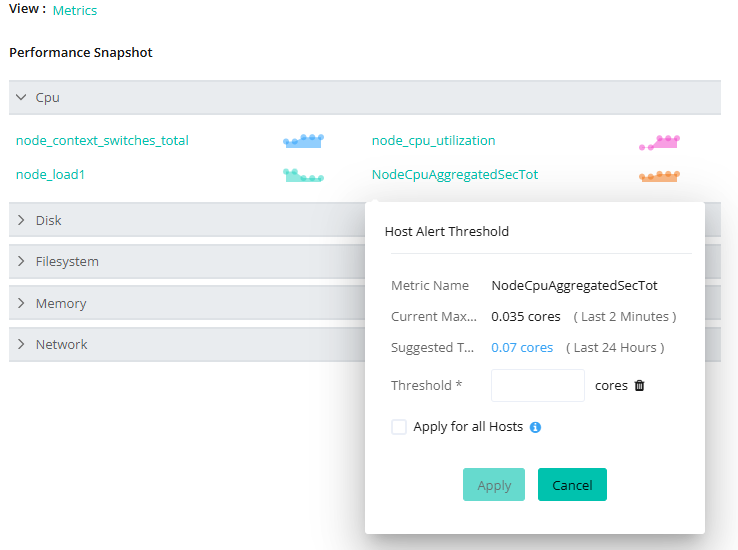
Host Alert Threshold shows the metric name, current maximum value, and suggested threshold value of each metric.
Define the specific value in the input field provided for the Threshold* and click Apply.
It notifies you of an alert when it exceeds the defined value.
Note
If the change impact is needed for all hosts, check Apply for all Hosts.
Similarly, click on the Disk, Filesystem, Network, and Memory to expand these sections.