Global View Topology
Topology provides a unified graphical view of how applications and their underlying resources, like spanning cloud, on-premises, and containerized environments, are interconnected. It helps you to visualize entity relationships in the context of your applications, revealing dependencies, hierarchies, and data flow across hybrid infrastructures. By offering an end-to-end perspective, topology enables you to understand the overall state of your environment, identify issues within data paths, assess the health and impact of each component, and drill down into specific groups or entities to explore dependencies, interactions, and recent changes in a single, cohesive view.
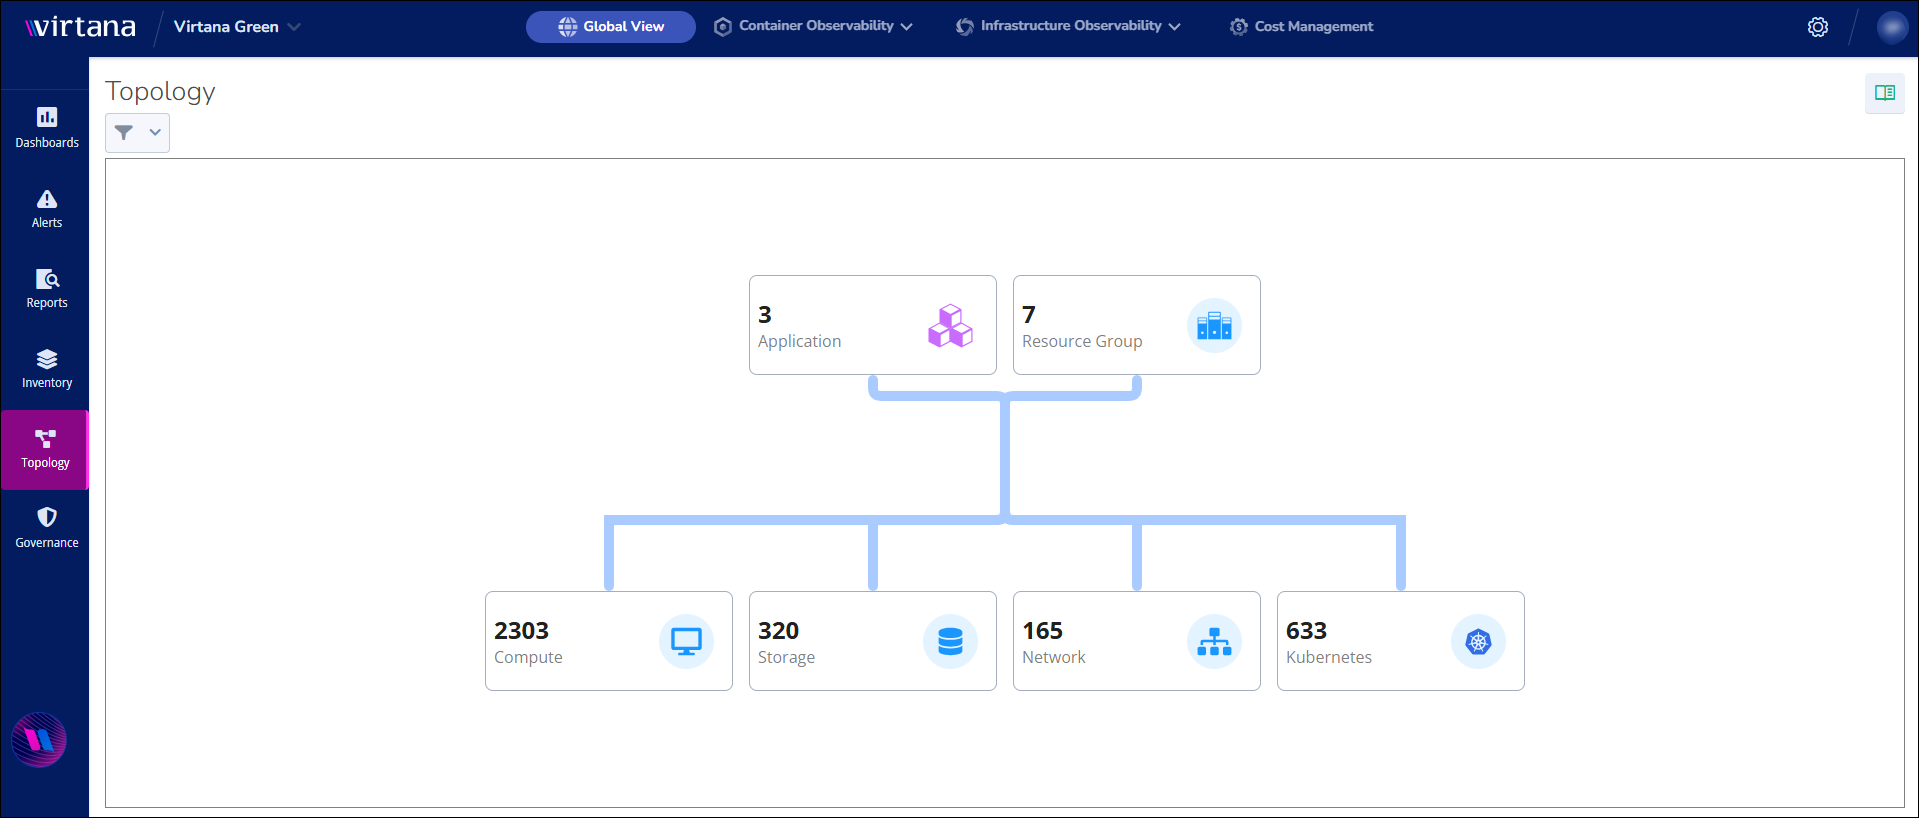
The topology section is categorized as follows in the Global View:
Icon | Description |
|---|---|
| Application: Refers to the logical grouping of services and components that deliver a specific business function. These functions are already being set up in your Infrastructure Observability (IO) repository. |
| Resource Group: A container that logically groups resources across hybrid environments, enabling visualization of topology and faster issue identification across connected components such as AWS EC2 instances, on-prem storage, and Kubernetes containers. See Creating resource groups to create Resource Groups. |
| Compute: This section contains all computational resources, including virtual machines (VMs), hosts, and nodes. |
| Storage: Provides visibility into storage performance, capacity, and availability. It includes entities like storage arrays and volumes. |
| Network: This section focuses on mapping and monitoring the connectivity and flow between components, providing real-time inventory and topology mapping. It includes entities like switches and network paths. |
| Kubernetes: Automates the deployment, scaling, and management of clusters through a container observability platform. You can select a cluster to view the entities that are connected to it, such as namespaces or deployments. |
| Trace Services: This allows you to focus on a particular service and its direct and indirect interactions within your environment, making it easier to troubleshoot issues or analyze service dependencies. You can filter the topology view by specific trace services. Traces are collected and processed, with key attributes, such as service name, namespace, region, data center, and environment, extracted for topology mapping. |


Note
In Topology, you can only able to see entity properties and linked entities and clusters, but you are not able to create and manage the existing entities in the respective categories. Entities in the topology are automatically discovered and mapped based on data collected from Infrastructure Observability (IO) and Container Observability (CO).
Accessing Filters
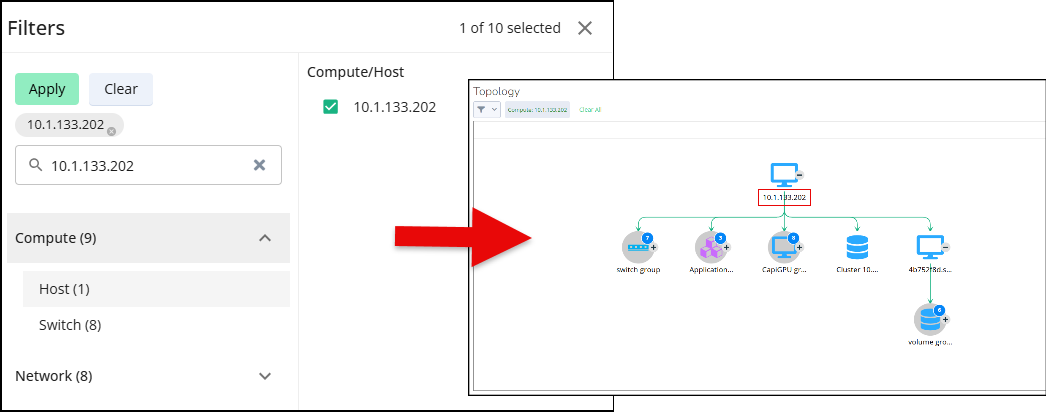
You can access the filter in a couple of ways. Click the filter icon to open the filter window, or click any category tile, which opens the Filters window.
Select the required category. You can view the list of entities on the right.
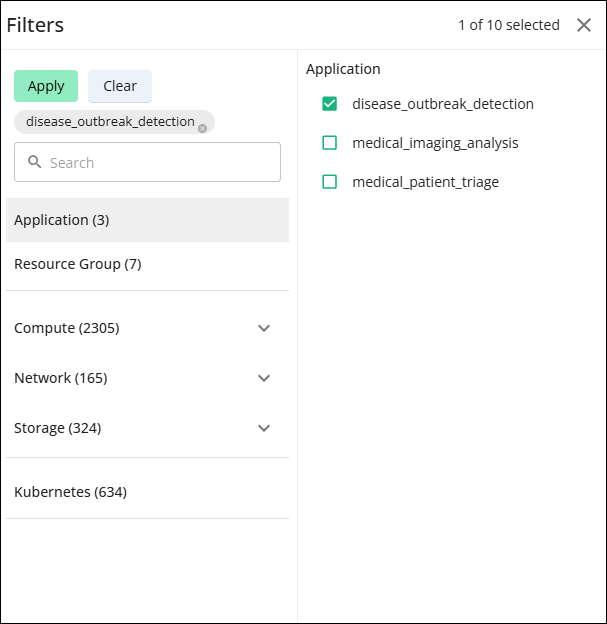
Select any entity and click Apply.
A topology page opens with the selected category node layout.
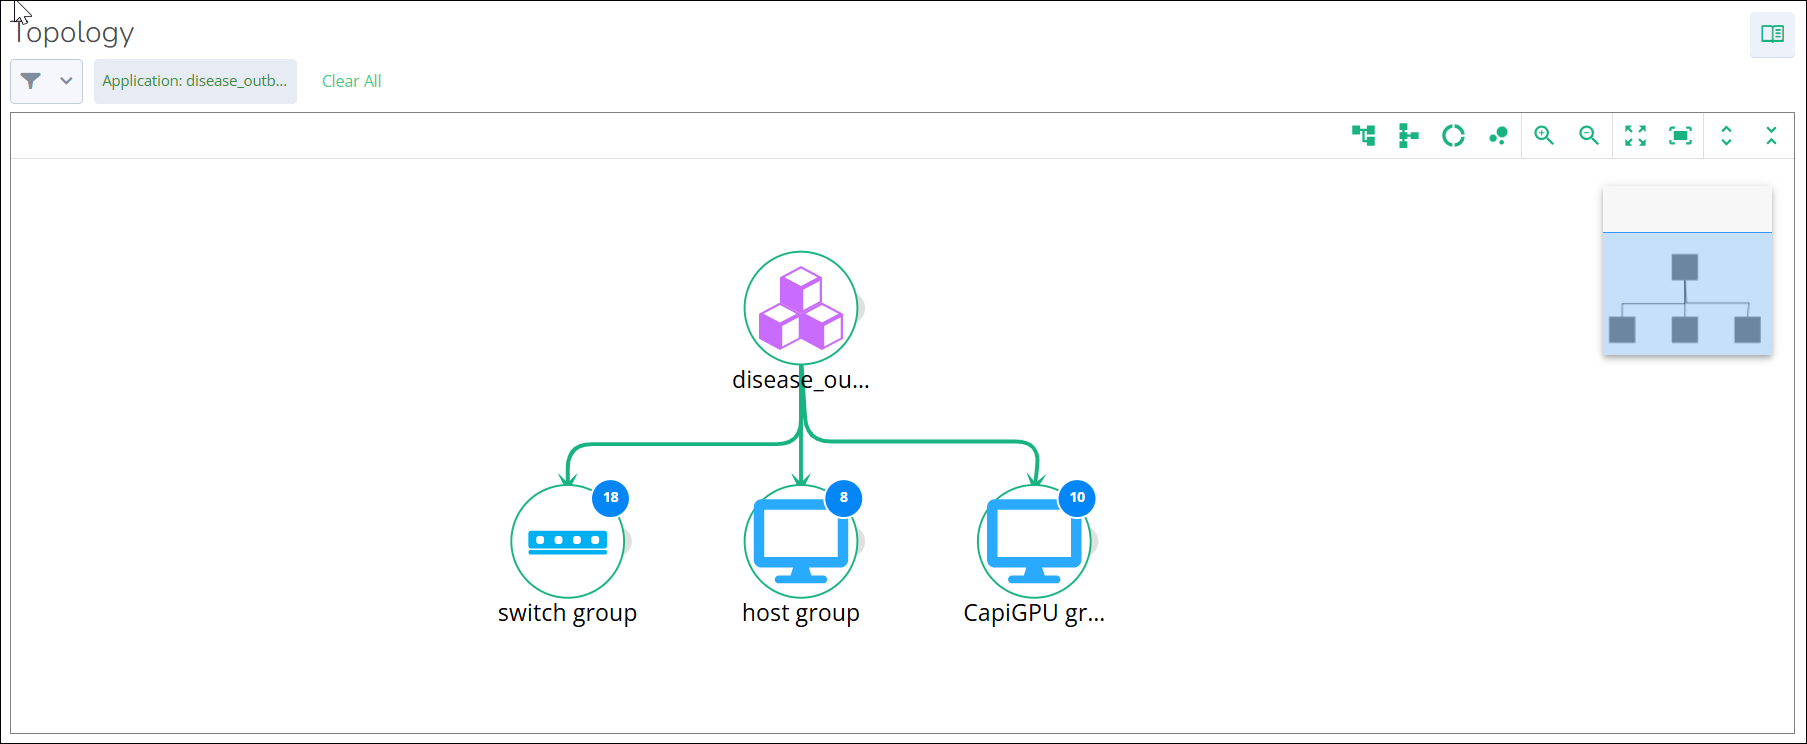
To show all nodes, click the node expand button in the top right corner. To expand each node individually, click the plus sign icon visible next to the node.
To view the entity details, click on any node.
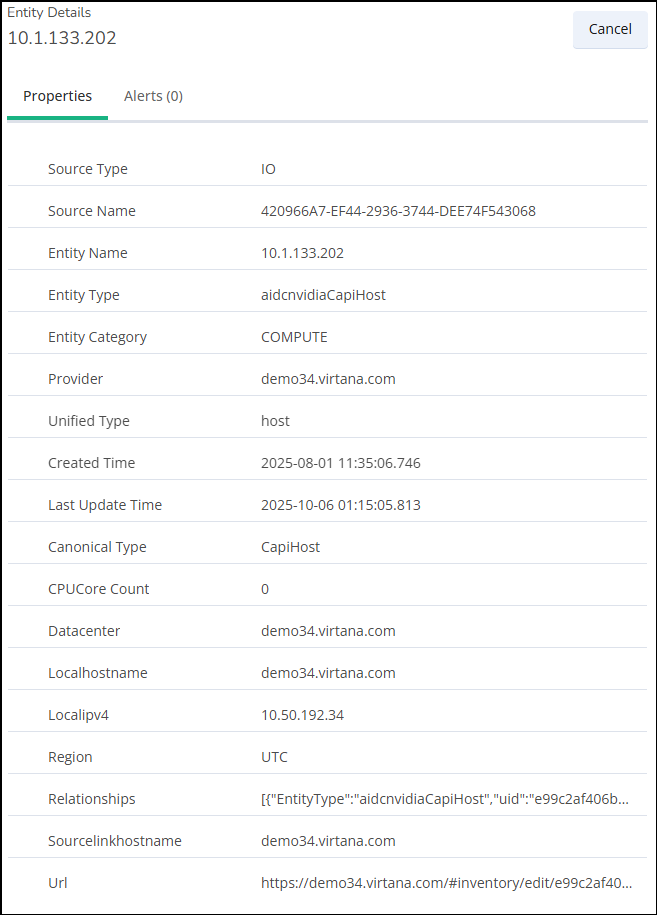
To check the node alerts, click on the Alerts tab.
(Optional) If you need a more specific result, search for the entity in the search bar in the filter window, select the entity, and click Apply.
Viewing Trace Services
The Global View topology lets you observe trace services, visualize service relationships, drill down into tracepaths, and service-level health across your hybrid estate. You can access the trace topology to obtain an end‑to‑end, graph‑based representation of trace services and their interactions, annotated with request rate, latency, and error metrics. You can precisely analyze traffic flows through instrumented and uninstrumented services, understand upstream/downstream dependencies, and perform targeted root‑cause analysis of performance or availability issues in hybrid environments.
The trace data from your application becomes available in the Global View topology after you deploy the OpenTelemetry trace pipeline for the platform. To view the trace data in the Global View topology, perform the following steps:
Log in to the Virtana Platform and navigate to Global View > Topology.
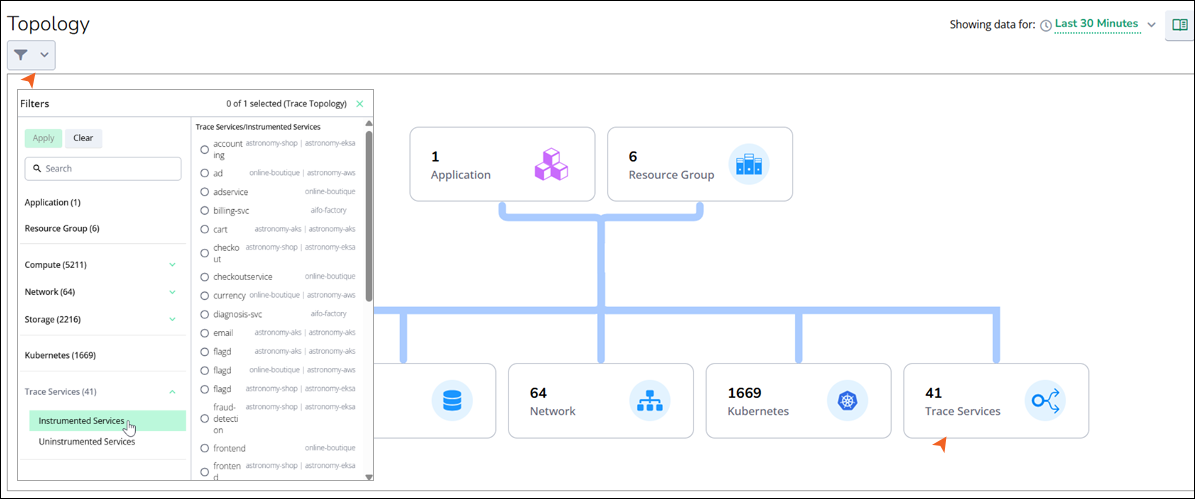
Select Trace Service from the filter or tab.
You can view Instrumented Services and Uninstrumented Services options in the dropdown.
Instrumented Services: Application services that emit telemetry data directly to Virtana Platform, typically through OpenTelemetry or another supported tracing/metrics library. It supports deep drill‑downs into service performance and dependencies.
Uninstrumented Services: Services that do not emit telemetry data. Virtana Platform infers their existence and behavior from the other environment, such as network flows or calls observed from instrumented neighbors. You cannot drill into full request traces for them until you add instrumentation. This includes providing visibility into third-party services, such as a payment provider (PayPal, Google Pay), where you cannot instrument monitoring.
Select any service, for example, Instrumented Services, and select the required service in the Trace Services/Instrumented Services column.
You can view the detailed chart of the particular service that appears as a node in the topology.
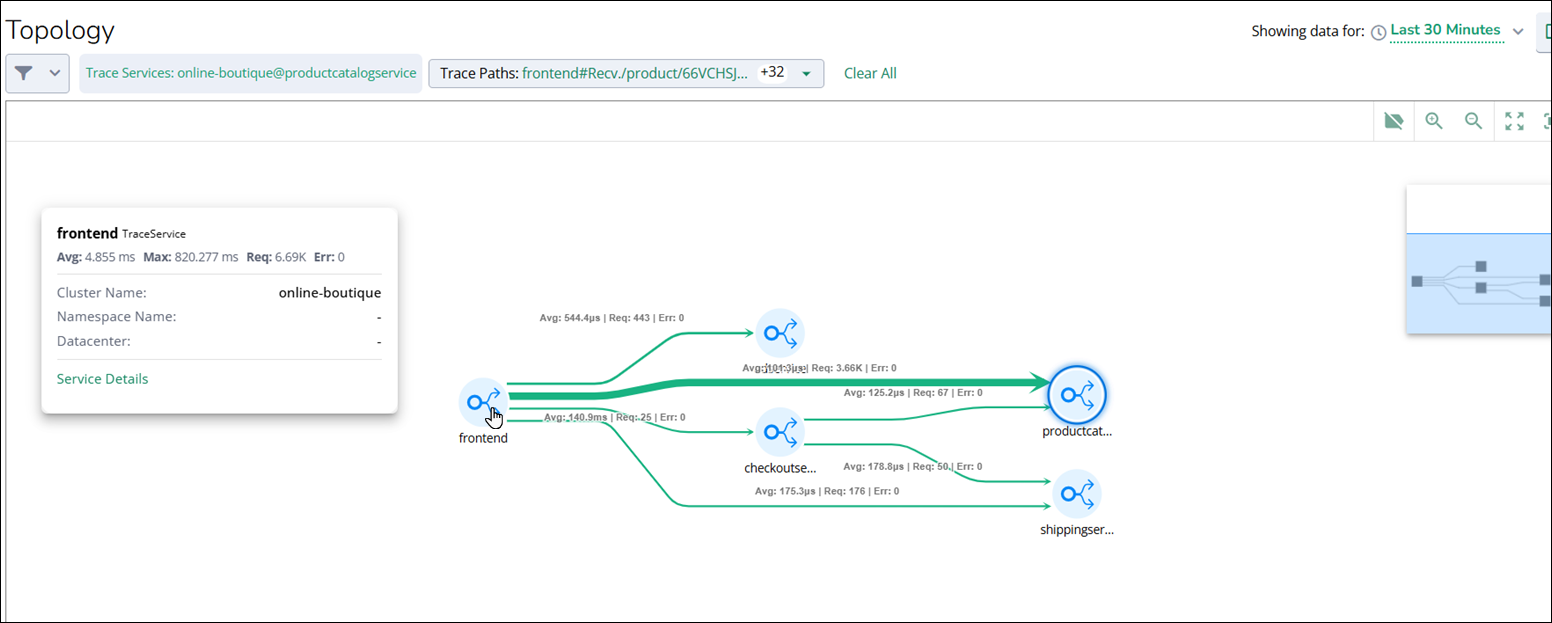
In the topology chart, click on any node to view average latency, maximum observed latency, total request count, and error count. You can also view contextual information, such as the Kubernetes cluster name, namespace, and datacenter, when available.
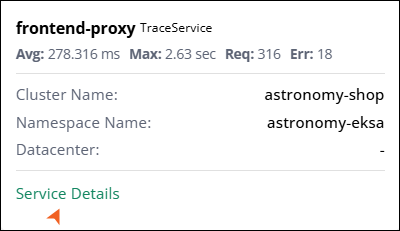
Click Service Details to view the entity details for the selected service.
You can view the following tabs in the pop-up window:
Component
Description
Service Tracepaths
Lists tracepaths where the selected service is the primary trace service, showing its direct request flows and performance.
All Tracepaths
Lists every tracepath that involves the selected service anywhere in the call graph, for a complete interaction view.
Configuration Topology
Visualizes the configuration‑level topology of the selected service and all structurally related infrastructure entities.
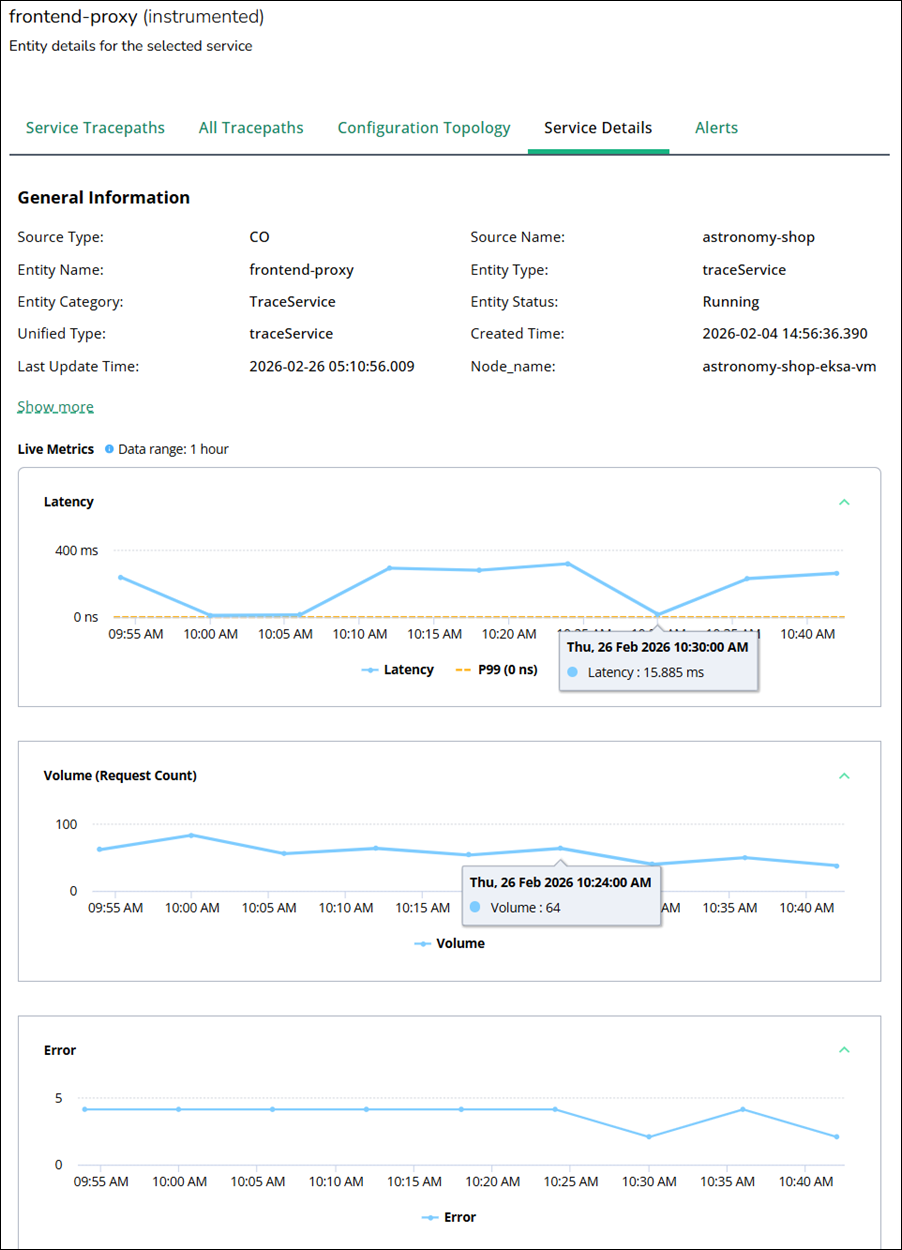
Service Details
Shows the selected service’s core metadata and live performance metrics such as latency, volume, and errors.
Alerts
Lists all alerts associated with the selected service, including status, timing, and diagnostic insights.
Click any visible arrow between the nodes to view the tracepath details, which include Tracepath name, Request count, Errors, and Latency Average (ms).
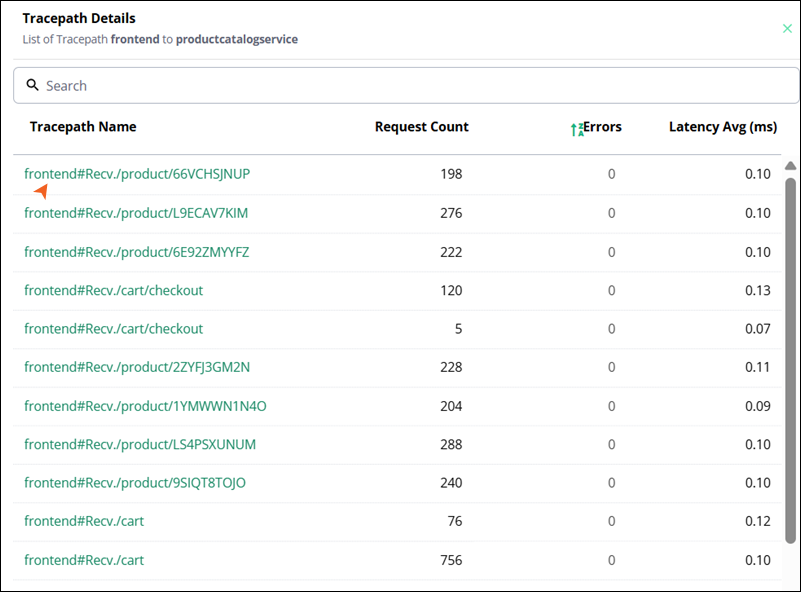
You can click on the particular trace path name to drill in detail.
(Optional) To view the required trace data as per the required time span, edit the time span in Showing data for (Last 30 Minutes by default).
Service Details
The Service Details tab presents the core metadata and live performance metrics for the selected trace service entity. It provides a focused overview of your service that includes metadata and time-series metrics.
You can use this dashboard to monitor the health and behavior of the service over time and verify whether deployments or configuration changes affect its performance.
The tab is divided into two main sections:
General Information
This section lists static and slowly changing attributes that describe how Virtana Platform models the service. Typical fields include:
Component
Description
Source Type
The data source that discovered the service, for example, CO.
Source Name
Logical grouping or application name from which the entity is sourced.
Entity Name
The display name of the trace service, usually derived from the
service.nameattribute in telemetry.Entity Type
The specific entity type, for example, traceService.
Entity Category
The broader category, such as traceService, that classifies the object in the entity model.
Unified Type
The normalized type used across sources, which allows Virtana Platform to treat equivalent entities uniformly.
Provider
The provider or environment label associated with the entity.
Created Time
Timestamp when the entity was first discovered.
Last Update Time
Timestamp of the latest update to the entity, typically the last time telemetry was ingested.
Node name
Stable identifiers that the Virtana Platform uses to correlate this service across sources and over time.
To view more details, click Show more.
Live Metrics
Live Metrics shows near real‑time charts for the service over a short, fixed window. For a trace service, this usually includes:
A latency chart with the overall average latency for requests handled by the service.
A volume chart that includes the total number of requests processed by this service during an hour of the time range.
An error chart that includes the total number of failed requests for a service during an hour of the time range.
Service tracepaths
In this tab, you can view the list of tracepaths in which the selected service serves as the primary trace service for the current topology context. You can view this tab to evaluate how the service performs when clients call it directly, for example, when validating the SLA of a public API or UI-facing service.
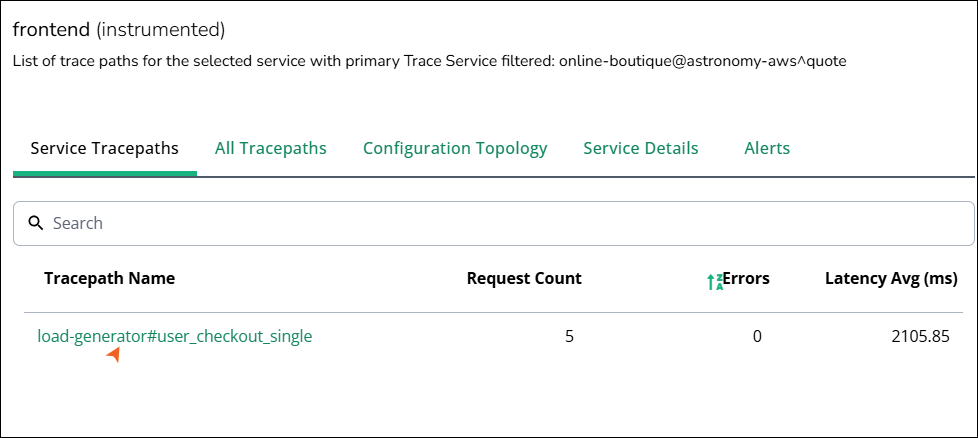 |
The tab contains a search field that filters rows by tracepath name and a table with a detailed list of tracepaths.
Column name | Description |
|---|---|
Tracepath Name | The canonical identifier for the path, derived from trace attributes. The name usually follows a pattern, where the prefix identifies the caller or scenario and the suffix identifies the operation. |
Request Count | The total number of requests that matched this tracepath within the active time range of the Global View topology. |
Errors | The number of failed requests on this path in the same time range. This count is computed from span status and error attributes. |
Latency Avg (ms) | Average end‑to‑end latency for this tracepath, in milliseconds, over the selected time window. |
To drill in detail, click a tracepath under the tracepath name column. You can view the tracepath details in a new window. For more information, see Trace Maps.
All tracepaths
You can view every tracepath that involves the selected service, regardless of whether the service is the primary trace service in the all tracepaths tab. In this tab, you can view the same details as you can view in the service tracepath tab. You can view this tab to understand the service’s role across the application. It helps identify upstream callers, downstream dependencies, and performance or error patterns affecting end-to-end request flows.
The key difference from Service Tracepaths is that the table includes all tracepaths where the service appears anywhere in the call graph, not only those where it is considered the primary trace service. These details could be useful when you need a complete picture of every trace‑based interaction that touches a given service, including indirect scenarios.
Configuration Topology
In the Configuration Topology tab, you can view the configuration‑level topology for the selected service. This is a chart of all entities that are structurally related to the service, not just those discovered from traces.
You can use this tab to correlate service performance with infrastructure resources. For example, determine whether latency spikes are associated with a specific pod, node, or data center.
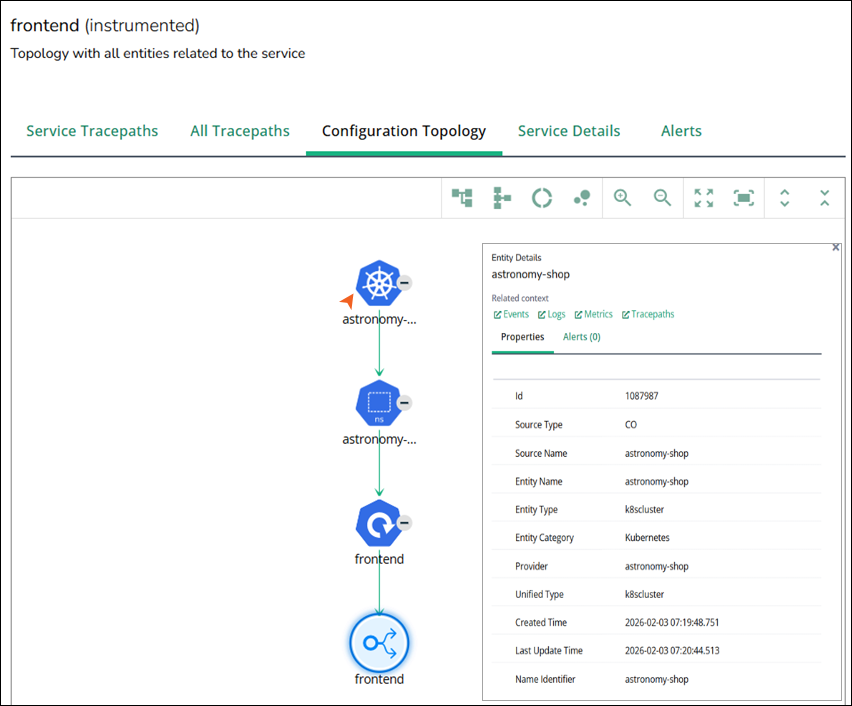
The selected trace service is highlighted, and its related configuration entities are arranged around it. Typical entities include:
The Kubernetes cluster that hosts the service.
The namespace in which the workload runs.
Workloads, deployments, pods, or other compute entities associated with the service.
The trace service entity itself.
Select nodes to view their individual entity details, that includes the node properties and the active alerts.
Alerts
In this tab, you can view alerts that are associated with the selected service. It connects the service‑centric view with the alerting and incident signals generated elsewhere in Virtana Platform.
View this tab to investigate incidents affecting the service. Start from an alert and drill down into tracepaths or configuration topology to identify the root cause.
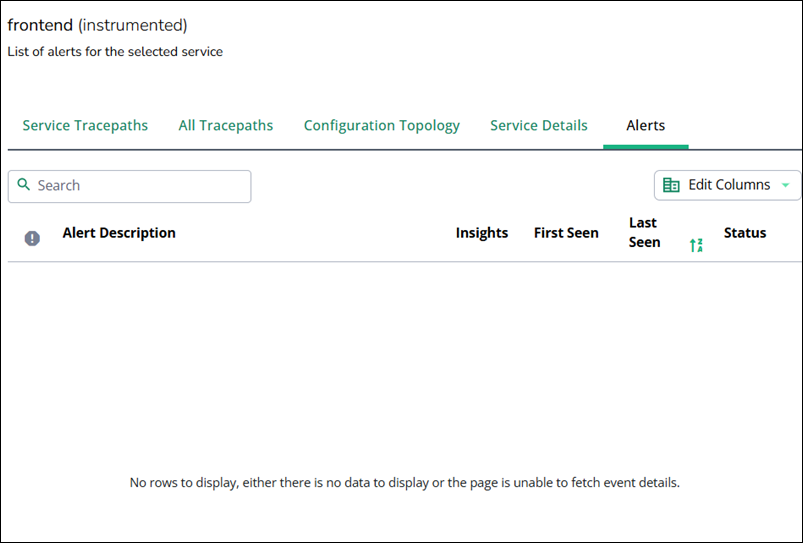
The tab contains a search field that filters alerts by text in the description and a table with a detailed list of alerts.
Column name | Description |
|---|---|
Alert Description | A readable description of the alert condition. |
Insights | Links or annotations that provide extra diagnostic context, such as related events or recommended next steps. |
First Seen | Timestamp when this alert was first triggered for the service. |
Last Seen | Timestamp of the most recent occurrence for the same alert key. |
Status | Current state of the alert, such as Active, Acknowledged, or Closed. |
You can modify the table according to the required details in Edit Columns.
When no alerts match the service and current filters, the tab displays a message indicating that there is no data to show or that alert data is temporarily unavailable.