Performance Snapshot of a Node
The Performance Snapshot page shows the performance of a particular node in terms of requests, response times, and resource utilization, like CPU, Disk, Memory, and Network.
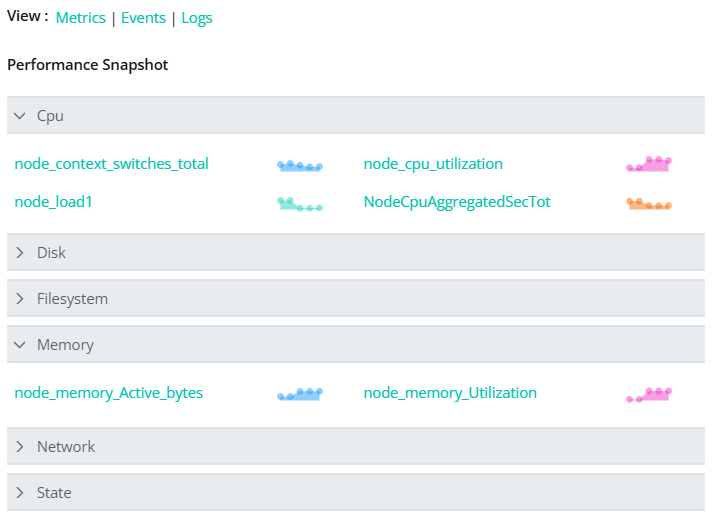
Click on the CPU to expand the section.
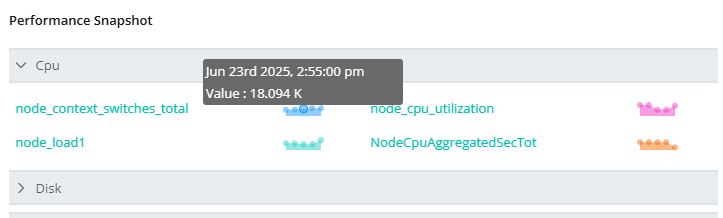
Hovering over each graph will display the metrics data of the node in each time interval.
Click on any entity.
It will display the entity's threshold data for the node.
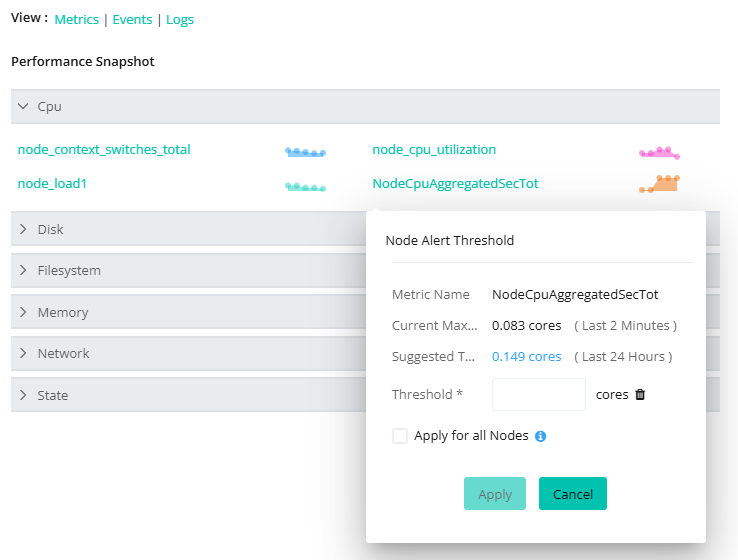
Node Alert Threshold shows the metric name, current maximum value, and suggested threshold value of each metric.
Define the specific value in the input field provided for the Threshold*.
It notifies you of an alert when it exceeds the defined value.
Similarly, click on Disk, Filesystem, Memory, Network, and State to expand these sections.
Note
You can also set the threshold SLO target for the metric of the node.