Create a Graph tile for one entity and metric
You can use the Graph tile to display a diagram for any entity in a dashboard’s scope. This tutorial demonstrates finding a one entity and one metric and featuring them in a Graph tile.
Tip
You can Add a Graph tile quickly without opening a dashboard from the Metric Dictionary page or any Smart View page.
To find the metric name for the tile, you’ll display an entity’s Smart View page, then open the metric dictionary.
In Virtana Service Observability, click the SMART VIEW tab.
In the search field, enter the name of a Linux host.
The following example shows a Linux server named se-demo07.
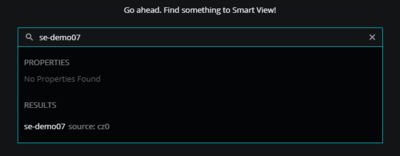
Select the entity name from the search results list to open the Smart View page for the host.
The following example shows just the anchor card area.
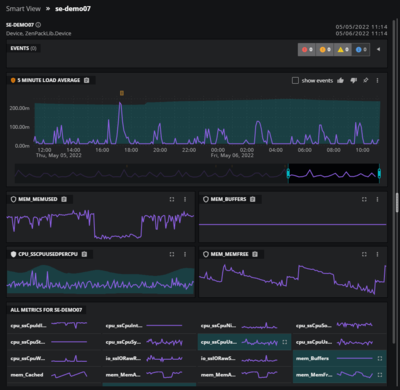
In the anchor card area, make the metric tile of the metric you want to feature on the dashboard the primary metric tile.
From the primary metric tile, open the metric dictionary editor.
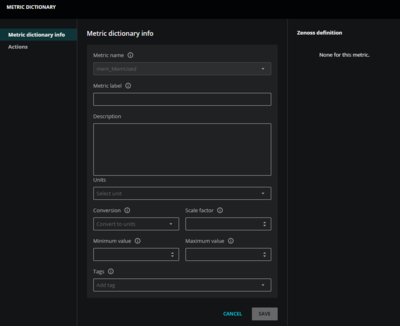
From the Metric name field, copy or record the metric name, and then close the METRIC DICTIONARY dialog box.
Create a new dashboard. See Creating dashboards
In the new dashboard, add a Graph tile.
When creating a new dashboard, click the Graph tile type on the AVAILABLE TILES panel on the right side. The GRAPH panel opens on the left side. By default, the TILE CONFIGURATION tab is selected.
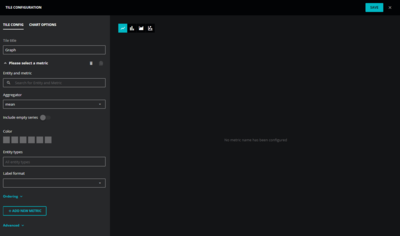
In the Entity and metric field, enter the name of the metric you copied from the metric dictionary editor.
For example,
mem_MemUsed.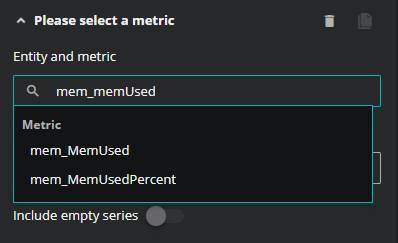
Select the metric name that matches your entry.
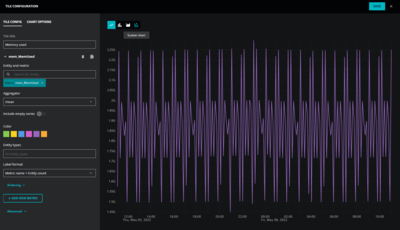
The dialog box updates to highlight your selection and to display a graph. By default, the graph is a line graph that aggregates data points from all entities in the dashboard scope that collect the metric.
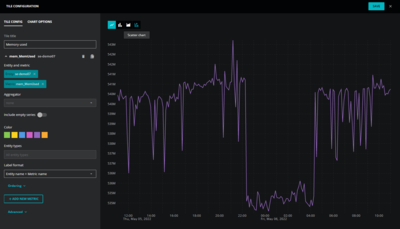
In the Entity and metric field, enter name of an entity.
In the preceding steps, the device name is
se-demo07. The query service displays matching entities as you enter a device name.Click the matching search result from the list immediately below the field.
The data in the display no longer aggregates data from other entities, so the Aggregator field is dimmed.
In the TILE CONFIGURATION panel, specify other fields as desired, and then click SAVE.
Reposition or resize the tile as desired.