Viewing query results
After you run a query or open a template, you can view a table of entities with one row per entity and one column for each property. This table provides a snapshot of the included entities and their key details, such as location, production state, and associated events.
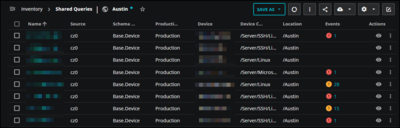
There are several actions you can take to help you with your investigation:
View summary
To view a visual summary of the entities included in the selected query, click Summary view. This is useful when you want a quick snapshot of key information about the entities in the selected inventory query. To close, click Summary view again.
The tiles in the summary view highlight useful information from the past 24 hours about the selected query results, including a breakdown of events and production states for your entities.
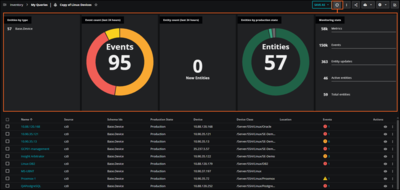
Tiles include:
Entities by type: The number of entities by type in the query results.
Event count: The Events donut chart lists the total number of events in the query with a breakdown by event type, including Critical, Error, and Warning. Hover your mouse over the donut chart to see the number of events by type.
Entity count: The number of new entities that are included in the query.
Entities by production state: The Entities donut chart lists the total number of entities in the query with a breakdown by assigned production state. Hover your mouse over the donut chart to see the number of entities in each state.
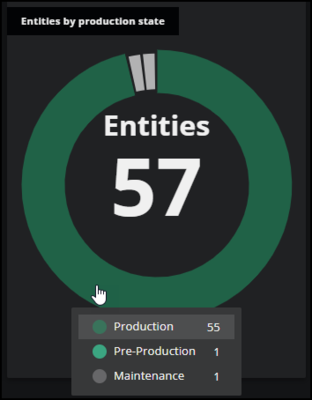
The chart displays only the production states included in the query. Each state is represented by a specific color, such as green for Production and gray for Maintenance, and a random color for custom production states.
Monitoring stats: This tile provides an overview of entity monitoring statistics for immediate insight into monitoring activity. The list captures high-level metrics based on your current query, including:
Metrics: Estimated total number of metrics collected.
Events: Estimated total number of raw events, which includes all instances of an event occurrence. As a result, this number may be higher when compared to data in the Events console.
Entity updates: Number of entity property updates, such as updated metadata for models in your CZ.
Active entities: Total number of active entities in the selected query. Active entities are ones which meet the query criteria and the time range, and are currently receiving data, such as events, metrics, and model updates.
Total entities: Total number of entities in the selected query for the time range. Note that Virtana may not be collecting or receiving data for some of these entities.
View entity details
To view additional information about an entity in the table, click the eye icon in the Actions column for the row. In the ENTITY DETAILS dialog box that opens, you can view more details and navigate to Smart View pages.
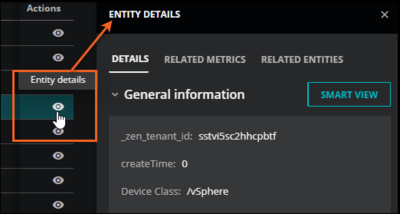
On the DETAILS tab, you can view core properties, metadata information about the entity, and custom properties (if any are associated with the entity). Click the SMART VIEW button to navigate to Smart View to examine the graphs and charts of an entity's metrics and events. You can also click the following tabs:
RELATED METRICS: Quickly view a snapshot of the current metrics for your entity.
RELATED ENTITIES: View metrics for related entities.
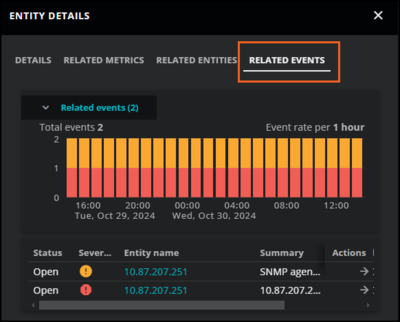
RELATED EVENTS: View related events.
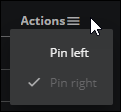
Optionally, you can choose to pin the Actions column on the left side of the table. To do so, click More actions next to the column name, then click Pin left.
View device details
If you created organizers in CZ, you can view devices in Inventory using the Organizers tab.
To view additional information about a selected device in the table, click the eye icon in the Actions column for the row. In the ENTITY DETAILS dialog box that opens, you can view more details and navigate to Smart View pages.
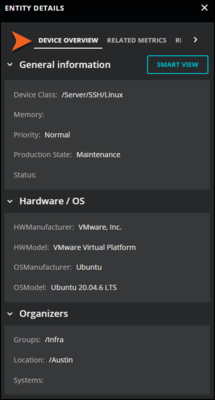
On the DEVICE OVERVIEW tab, you can view the following types of information:
General information: Device class, memory, priority, production state, and status
Hardware / OS: Hardware and OS component information
Organizers: List of organizers that contain the device
Hide or reorder columns
You can change how the properties appear in the table. To make changes, click Adjust columns from the Settings menu.
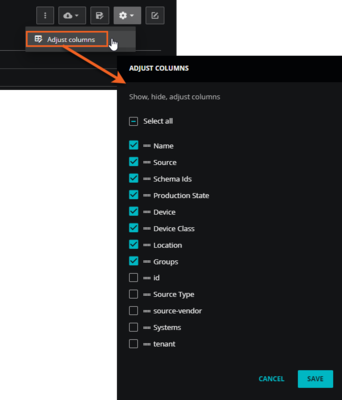
In the ADJUST COLUMNS dialog box that opens, you can select or clear the available columns, and change the order of the columns in the table.
Adjust column views
In the column menu, view the sorting options for that column, including Group by <column name>. This option is useful if you want to focus on a specific group of entities, such as a set of entities in a specific device class or a location of entities. You can choose to group entities in several key columns, including Device, Device Class, Groups, Location, Name, Schema IDs, Source, Source Type, and Systems.
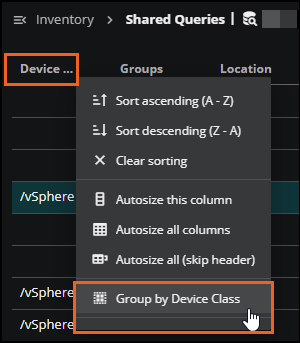
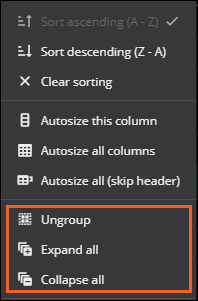
After you click Group by <column name>, expand the row to view the entities in that group. The number of entities within a group is indicated in parentheses. Open the column menu and choose to expand all the rows or collapse all the rows in the groups.
Filter table columns
If you created organizers in CZ, you can view devices in Inventory using the Organizers tab.
To refine your search for devices, apply filters on the Name, Device class, and Location columns. This is useful if you have a large number of devices.
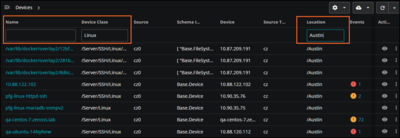
Filters are temporary, only applying to your current search. You can clear them by navigating to another category in Organizers or by clicking the Settings menu.
Sort rows
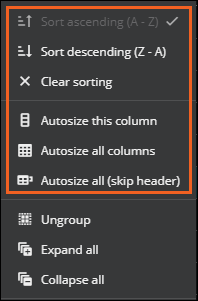
If you have a lot of entities to view, you can use the additional sorting options in this menu:
Sort the rows in ascending or descending alphabetical order, or clear any previously applied sort options.
Autosize the specified column or all the columns in the table, or choose to autosize all the column contents, but not the header.
Edit column headers
If you want to change an entity field to a friendlier name, you can edit the entity field in the Dictionary. For example, you might want to change "Source" to "My Source." For more information, see the Entity Fields page in the Dictionary.
Table actions menu
Use the table action buttons to quickly perform a variety of tasks, including saving, sharing, and exporting your results. The actions you see depend on your query or template. These action icons are located in the upper-right corner above the results table.

View the following table to learn more about table actions.
Icon | Action |
|---|---|
SAVE AS | Click to save the current query, save the current query as a new query, or discard your changes. When saving as a new query, you can update the title and description of the new query, and select a different icon for it. |
Summary view | Click to open the summary view of your query's results. |
Actions options | Click to add a maintenance window, update a production state, or update priority. |
Share | Make the inventory view public if you are the owner, or copy its URL to your clipboard. |
Settings | From Settings, click Adjust columns to open the ADJUST COLUMNS dialog box. Here, you can select or hide columns in the results table, or change the order of the columns in the table. Limiting the columns to just what you need can help avoid confusion. |
Export table | Download the results of the current query in HTML, CSV, Excel, or JSON format. You can export up to 100,000 rows of your Inventory table. Optionally, select the Email a copy checkbox to send a copy to your logged-in email address. This is useful for large datasets where you need to view the whole table. |
Refresh | Click to refresh the query results. |
Expand/Collapse query bar | Display or hide the query bar. |
Learn more
Working with queries in Inventory Understand how to create, manage, and use queries within Inventory.
Advanced Inventory Actions Explore advanced actions you can perform to manage Inventory effectively.
About production states Learn about different production states and how they impact Inventory items.
About Inventory Learn how to navigate and manage items within the Inventory module.