Global Kubernetes Resource Explorer
The Global Kubernetes Resource Explorer provides unified resource usage data for CPU and memory of Kubernetes compute resources (pods) across all your clusters.
With the Explorer, you get a flexible summary of resource data based on key relationships, such as Clusters, Namespace, and workload types, such as Deployment, DaemonSet, StatefulSet, Job Name, and specific Pod labels. This flexibility lets you instantly drill down into the data that matters most for your operational needs. The Explorer also analyze historical data to identify usage patterns, helping you quickly identify over- or under-utilized resources. Ultimately, this helps you understand your Kubernetes environment’s performance and capacity, ensuring the right balance between allocation and application needs. This inventory page reflects the data of only those entities that belong to Container Observability (CO).
Accessing the Explorer
Perform the following steps to access the Global Kubernetes Resource Explorer:
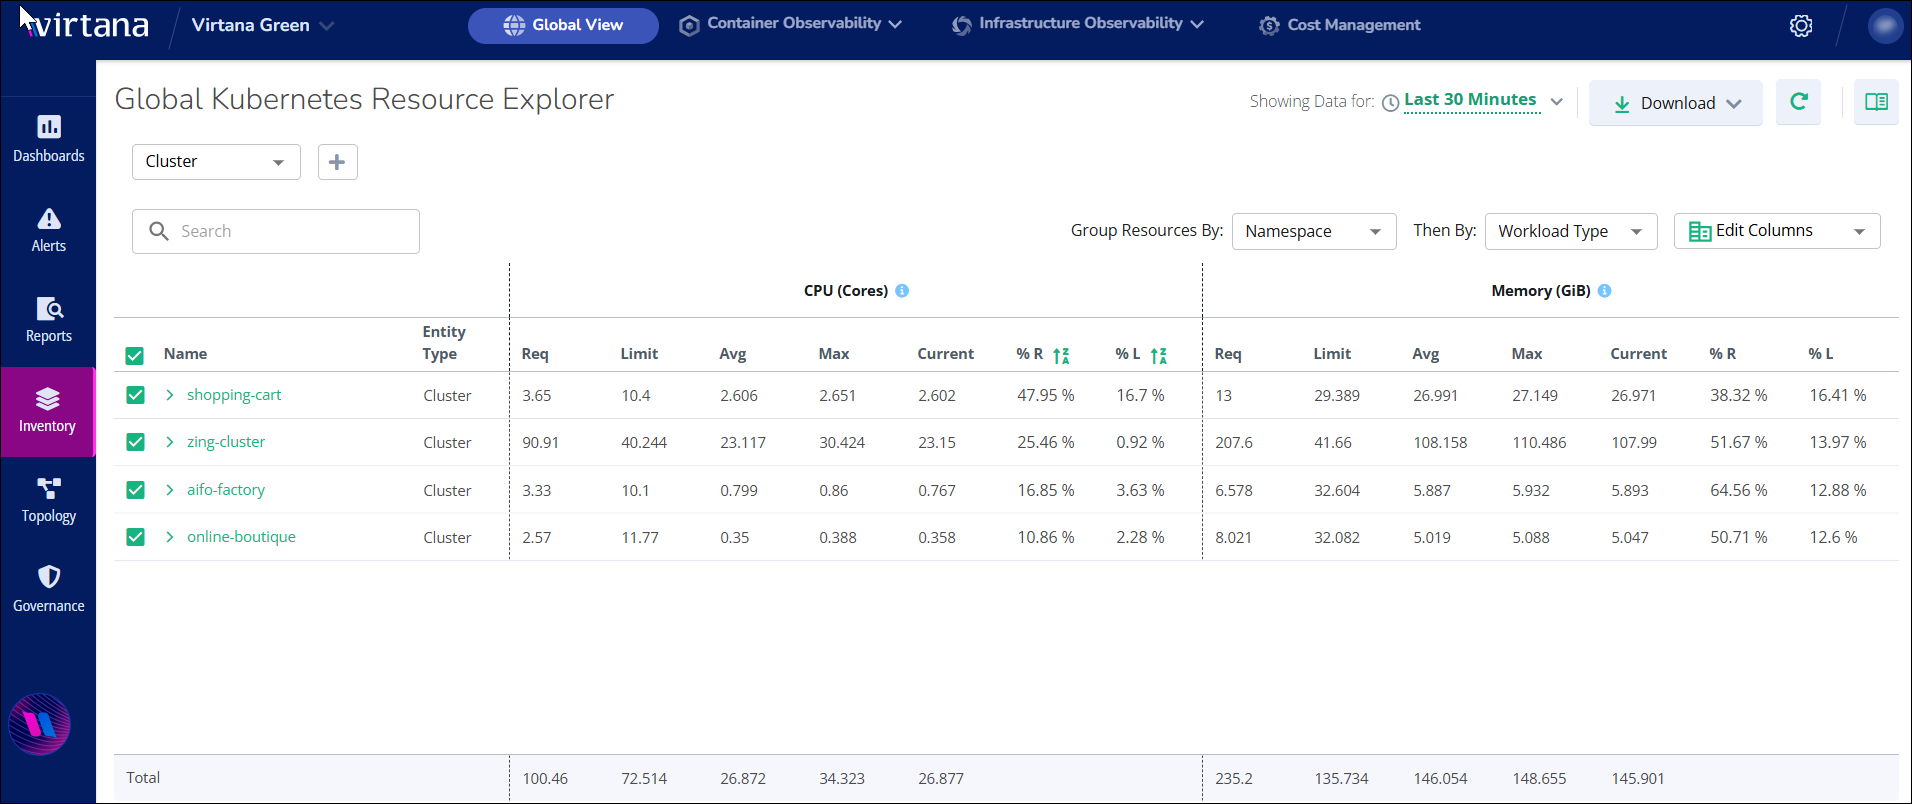
Navigate to the Global View in Virtana Platform.
In the navigation menu, click the Inventory tile.
The Global Kubernetes Resource Explorer page opens.
Kubernetes Resource Explorer Components
The Inventory section offers a comprehensive interface for monitoring and managing Kubernetes resource utilization. The following are its core features and metrics:
Setting your view
You can use these controls to define the scope and time frame of the data you are viewing.
Filter: To customize the displayed data, click the plus (+) symbol to add more options for filtering by Workload Type, for example, Namespace, Deployment, StatefulSet, DaemonSet, and Job Name.
Time Range Selection: Analyze trends and spot anomalies by adjusting the time window.
Searching your resources
The Explorer allows you to locate and aggregate specific entities across your environment quickly by using the following options.
Search Bar: You can use the search bar to filter for any entity by its name.
Group Resource by: Select a grouping to roll up the summary data based on relationships.
Namespace: Logical segregation for workloads.
Workload Type: Represents the desired state of Namespace, Deployment, StatefulSet, DaemonSet, and Job Name.
Pod Label: The type of tag that acts as metadata for categorizing and managing resources, such as pods, for example, application type or environment.
Edit Columns: You can use Edit Columns to select which data fields to show or hide.
Downloading Your Data
You can download the Metric sheet as a PDF for easy reference and offline analysis.
Viewing your metric data
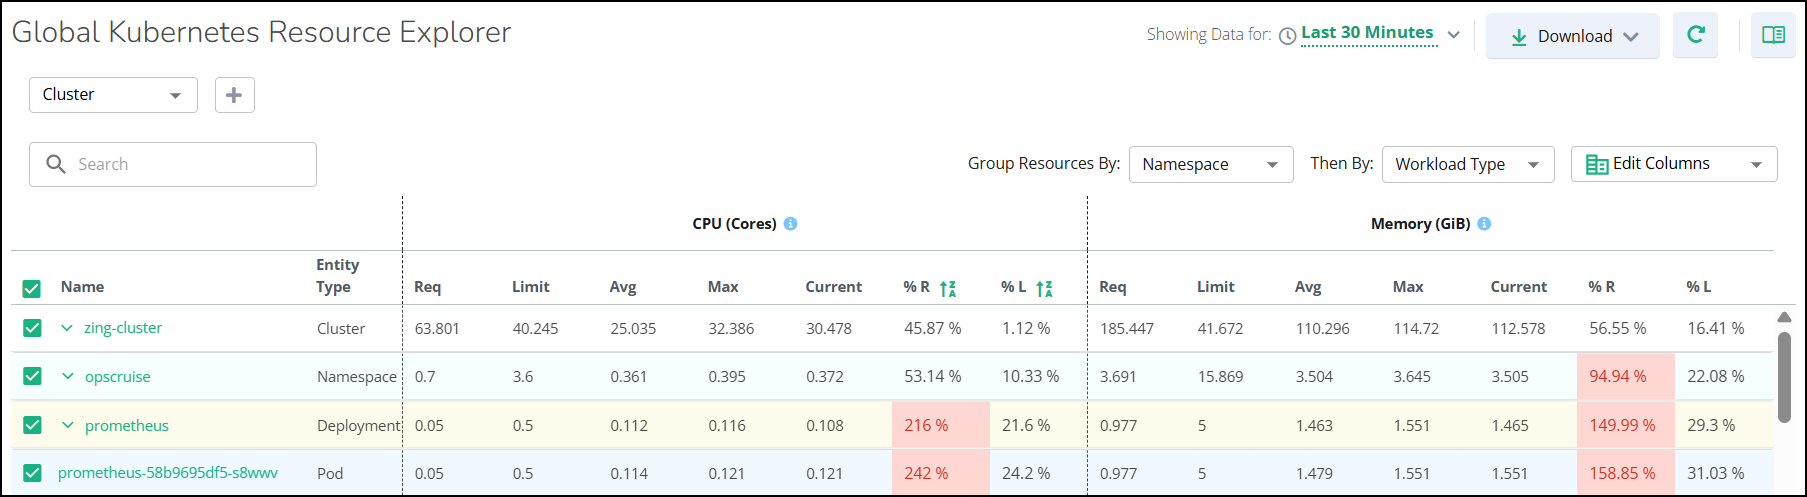
The main table displays resource metrics for CPU (Cores) and Memory (GiB). These metrics reflect the usage and limits of containers that have a CPU or Memory Usage Limit set in their specification.
Column Name | Description |
|---|---|
Name | The readable name of the entity. |
Entity Type | The Kubernetes resource type, such as Cluster, Namespace, and workload type like Namespace, Deployment, StatefulSet, DaemonSet, or Job Name. |
Req | The total requested resource is configured for the namespace or cluster. |
Limit | The total resource limit is configured. |
Avg | The average resource utilization over the selected time period. |
Max | The peak resource utilization is observed during the selected time period. |
Current | The current, real-time resource utilization. |
% R | Average usage as a percentage of requested capacity. |
% L | Average usage as a percentage of limit capacity. |
You can view the detailed average values of the complete Cluster in a top row with a white colour fill. The details of a particular Namespace are available below the Cluster row in the second level with a green colour fill. Following it are the details of a particular Deployment, DemonSet, or StatefulSet available below the Namespace row in the third level with a yellow colour fill.
You can also view the resource usage that exceeds critical thresholds in red font for the following use cases:
%R - Utilization (in %) against Request - Highlighted in red when the % value is greater than 90,
%L - Utilization (in %) against Limits - Highlighted in red when the % value is greater than 90.