Layer 3: Set up GPU infrastructure monitoring
Set up NVIDIA GPU monitoring so the Virtana platform can collect GPU utilization, efficiency, and workload data for your AI environment.
GPU infrastructure monitoring gives you visibility into the hardware layer of your AI stack. It tracks how your GPUs are performing, how efficiently they’re being used, and what workloads are running on them. This data helps you identify underutilized resources, detect performance bottlenecks, and make informed decisions about capacity planning.
The following related guides cover the rest of the AIFO stack:
Container orchestration monitoring: see Layer 2: Set up orchestration monitoring.
AI agent tracing: see Layer 1: Configure AI agent tracing.
Before you begin
Complete all of the following before you start. The steps in this guide assume Virtana IO is installed and accessible.
Prerequisite | Details |
|---|---|
Virtana IO installed and running | Virtana IO must be installed before you begin. See the Infrastructure Observability deployment. |
Virtana CO deployed (optional, recommended) | If your environment uses Kubernetes, deploy Virtana CO before you configure GPU monitoring. Virtana CO is optional but recommended for full-stack observability. See the Container Observability deployment. |
Kubernetes cluster with NVIDIA GPUs | Your Kubernetes cluster must have GPU-enabled nodes. Check supported Kubernetes versions and NVIDIA driver versions in the Install the Virtana NVIDIA Gateway before you proceed. |
Network access confirmed | Determine whether Virtana IO can reach your GPU hosts directly or whether a firewall separates them. See Choose your deployment model below. |
How it works
GPU infrastructure monitoring uses the Virtana NVIDIA Gateway (nvidia-gw) to scrape GPU metrics from your host systems and forward that data to IO Virtana. The gateway runs as a DaemonSet in your Kubernetes cluster, placing one pod on every GPU host. Each pod exposes GPU metrics at port 9400 by default, and the metrics are available for scraping at http://<host-ip>:9400/metrics. Virtana IO then makes the data available in the GPU Efficiency Dashboard and other platform views.
Choose your deployment model
Before you install anything, decide which model fits your network topology. One question determines your path: does Virtana IO have direct network access to the hosts in your Kubernetes cluster?
Model | When to use it |
|---|---|
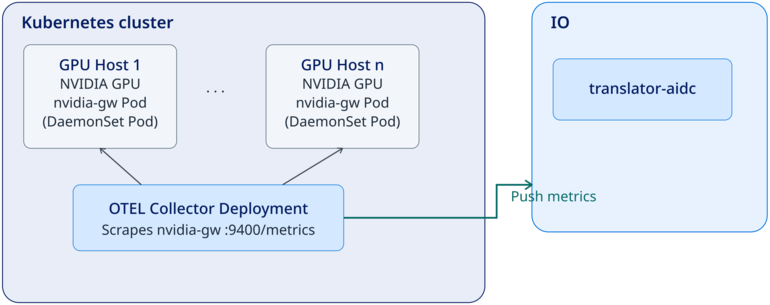
Push model | Use this model if a firewall or network policy prevents Virtana IO from reaching your GPU hosts directly. An OTel Collector is installed inside the Kubernetes cluster. It scrapes |
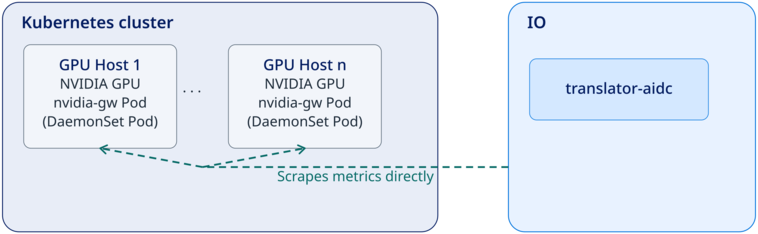
Pull model | Use this model if Virtana IO can reach your GPU hosts directly on port 9400. Virtana IO’s |
Note
If you’re unsure which model to use, and your hosts are accessible from your Virtana IO deployment, start with the pull model.
Push model
In the push model, an OTel Collector is installed inside the Kubernetes cluster. The collector scrapes the aidc-nvidia-gateway DaemonSet pods at :9400/metrics, then pushes the collected metrics to Virtana IO. Virtana IO does not initiate the connection.
 |
Pull model
In the pull model, Virtana IO’s translator-aidc component reaches across the network boundary and scrapes GPU metrics directly from the aidc-nvidia-gateway DaemonSet pod on each GPU host. Virtana IO initiates the connection. No OTel Collector is required.
 |
Deployment overview
The following table gives you an overview of the deployment process. Steps 1 and 2 are the same for both models. Step 3 differs based on the model you selected.
Step | Task | Details |
|---|---|---|
1 | Install Virtana IO | Virtana IO must be installed first. See the Infrastructure Observability deployment. |
2 | Install the Virtana NVIDIA Gateway | Install the |
3a | Pull model: configure Virtana IO to scrape the gateway | Configure |
3b | Push model: deploy and configure the OTel Collector | Deploy the OTel Collector inside your Kubernetes cluster and configure it to push metrics to Virtana IO. See Deploy and configure the OTel Collector (push model) below. |
Note
Follow either step 3a or step 3b based on the deployment model you selected. You do not need to complete both.
Install the Virtana NVIDIA Gateway
The Virtana NVIDIA Gateway (aidc-nvidia-gateway) is deployed as a DaemonSet in your Kubernetes cluster. A DaemonSet ensures that one gateway pod runs on every GPU host automatically, including hosts added to the cluster later. You install the gateway once, and Kubernetes manages deployment to all hosts.
Follow the full installation steps in the Install the Virtana NVIDIA Gateway, which provides prerequisites specific to your deployment, including supported Kubernetes versions and NVIDIA driver versions. After installation, verify the DaemonSet is running before you proceed to pipeline configuration.
To verify the gateway is running, do the following:
Run the following command, replacing
<your-namespace>with the Kubernetes namespace where you installed the gateway. If you used the default installation path, the namespace isvirtana-aidc:kubectl get daemonset aidc-nvidia-gateway -n <your-namespace>
Check the output. The DESIRED and READY values must match before you continue:
NAME       DESIRED   CURRENT   READY   UP-TO-DATE   AVAILABLE
aidc-nvidia-gateway  3         3         3       3            3
Important
If the READY count is less than DESIRED, the gateway pods are not running on all GPU hosts. Do not proceed to pipeline configuration. Check the pod logs:
kubectl logs daemonset/aidc-nvidia-gateway -n <your-namespace>
Configure the pipeline
After the Virtana NVIDIA Gateway is installed and running, configure the pipeline to forward GPU metrics to Virtana IO. Follow the steps for the deployment model you selected.
Configure Virtana IO to scrape the gateway (pull model)
In the pull model, Virtana IO’s translator-aidc component scrapes the nvidia-gw Kubernetes Service at :9400/metrics. No additional collector component is required.
Find the IP address of your Virtana IO deployment before you begin.
To configure Virtana IO to scrape the gateway:
Sign in to the Virtana platform.
Navigate to Infrastructure Observability > Integrations > NVIDIA GPU.
Select Add, enter the hostname where the NVIDIA Gateway is running, and select Save.
GPU monitoring is now configured.
Deploy and configure the OTel Collector (push model)
In the push model, an OTel Collector is deployed inside your Kubernetes cluster. The collector scrapes the nvidia-gw pods at :9400/metrics and pushes the data to Virtana IO.
To find your Virtana IO instance URL, sign in to the Virtana platform and navigate to Settings > System > Endpoint. Use this internal hostname or IP, not your browser login URL, when you set the exporter endpoint below.
To deploy and configure the OTel Collector:
Follow the OTel Collector installation steps in the AIFO Collector Deployment. The guide provides the base configuration file that you edit in the following steps.
Open
otel-collector-config.yamlin a text editor and set the exporters endpoint to your Virtana IO instance. Replace<your-io-instance>with the Virtana IO endpoint URL from Settings > System > Endpoint:virtana-aifo-otel-collector: configMap: exporters: otlp: endpoint: "https://<your-io-instance>:5100"Save the file. Apply the configuration, replacing <your-namespace> with the namespace where the gateway is installed (default: virtana-aidc):
kubectl apply -f otel-collector-config.yaml -n <your-namespace>
Confirm the collector pod is running:
kubectl get pods -n <your-namespace> | grep otel-collector
The output should show the collector pod in Running status before you continue.
GPU monitoring is now configured.