Token Usage Dashboard
The Token Usage Dashboard is part of Virtana’s AI Factory Observability (AIFO). It provides real-time visibility into the cost, performance, and reliability of Large Language Model (LLM) workloads across hosts, containers, and services.
A token represents a basic unit of processing, such as a word fragment or symbol, that an LLM handles during inference or training operations. Monitoring token usage helps you align performance, cost, and efficiency across your AI infrastructure.
Overview
The Token Usage Dashboard in the Virtana Platform gives you a clear view of how your AI workloads use system resources. It helps you see where GPU power is being spent, so you can easily spot performance issues and make better use of your hardware.
Virtana shows token usage in two simple ways:
Container-Level Tracking
The dashboard collects overall usage data from your containers (for example, NVIDIA NIM containers).
You can see how each container uses tokens and how that affects GPU performance.
This helps you find if some containers are using too much or too little GPU capacity.
Example: If one container uses only 2% of GPU capacity while another uses 98%, you may have a “noisy neighbor” problem, where one process takes most of the GPU. You can then adjust workloads to balance performance.
Application-Level Tracking
Some applications send OpenTelemetry data that includes token usage and timing information.
Virtana combines this data to show how tokens are used across different applications, helping you relate it to performance.
Example: The dashboard may show that an AI imaging app consumes many tokens but produces low GPU output. This can mean the app needs performance tuning or load redistribution.
Understanding NIM and Non-NIM Models
In Virtana AIFO, token data can be extracted differently based on the model type:
NIM Models (NVIDIA Inference Microservices)
NIM models are containerized inference services optimized for GPU workloads. Each NIM container operates as a self-contained LLM instance with built-in metrics collection capabilities. This allows Virtana to directly retrieve token usage metrics from the instance without additional configuration.
Non-NIM Models:
For non-NIM models, integration requires a LiteLLM proxy. The proxy emits OpenTelemetry traces containing token usage, latency, and request metadata on behalf of the underlying model. Virtana then ingests these traces to calculate token metrics and performance patterns.
Token Usage dashboard views
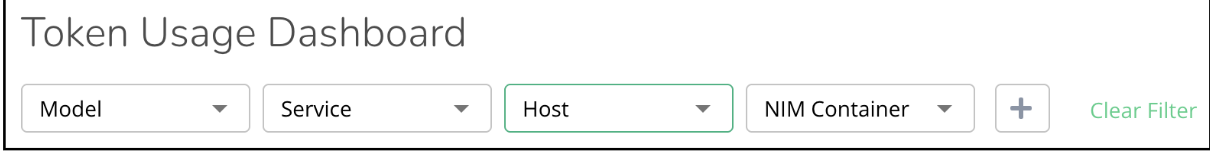
You can create a token usage view by selecting filters at the top of the dashboard. Start by choosing the deployments you want to analyze, then refine your view further with optional filters.
These filters include Model, Service, Host, and NIM Container, allowing you to narrow the scope for more precise insights. This flexible filtering helps you focus on specific aspects of your AI workloads for better monitoring and optimization.
Prerequisites
To get started using the GPU fleet analysis dashboard, ensure that you have the following requirements:
Virtana monitoring agents or API integrations must be deployed on all GPU-capable nodes for cloud and on-premises.
An active Virtana account with dashboard access permissions refer to Set up access between Infrastructure Observability and Global View
Network connectivity to Virtana Platform from all GPU environments.
Cost Meter Card configured to track GPU usage and associated costs across environments.
(Optional) Integration with NVIDIA DCGM (NVIDIA Data Center GPU Manager) Exporter for enhanced Kubernetes support.
OpenTelemetry traces enabled in all LLMs or applications to send token data.
Create and securely store API tokens under Settings > API Token Management.
Configure cost meter cards
Create a cost meter card to capture GPU-related cost metrics that you can view in the GPU fleet analysis dashboard. Cost meter cards help define pricing categories, such as compute, GPU, and storage, as well as corresponding units, so you can track costs and view reports of GPU usage.
To get started, see Creating Cost Meter Cards
Open the dashboard
Be sure that your Virtana account has permissions for the Token usage dashboard. After opening the dashboard, set the filters for your token.
Log in to the Virtana Global View and click Dashboards.
Select Token Usage Dashboard. The dashboard opens.
Create your view by choosing filters.
Download the dashboard
You can download the main dashboard page as a PDF document. This is useful when you want to create a filtered view of the dashboard to share as a report with your teams.
To save your dashboard locally, click Download > PDF document.

Viewing the Token Usage dashboard
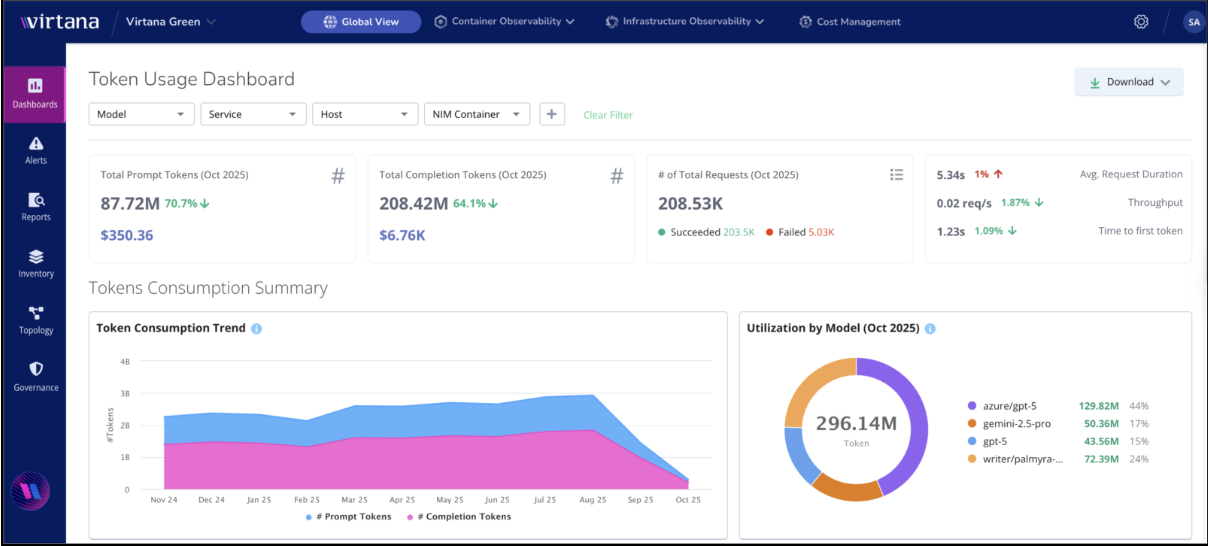
When you open the dashboard, you immediately see a snapshot of the health of your selected token usage data. The Token Usage Dashboard visualizes token metrics alongside key performance and cost indicators, offering a comprehensive view of your AI workloads.
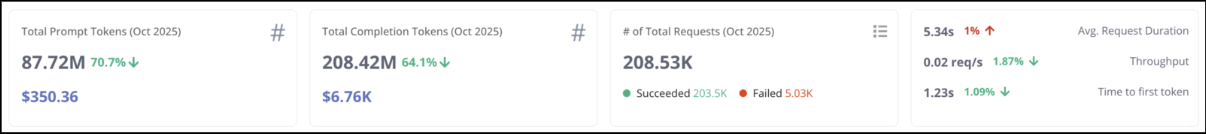
Let’s explore each of these key metrics in detail:
Total Prompt Tokens
The total number of input tokens processed by the models during the selected period. Helps estimate costs based on prompt length and design.
Total Completion Tokens
The total number of output tokens generated by the models. Useful for correlating output size with user prompts.
Total Requests
The total number of API requests processed, including successful and failed ones.
Average Request Duration (s)
The average time taken for a request to complete. A key measure of responsiveness.
Throughput (req/s)
The number of requests handled per second. Indicates system scalability and efficiency.
Time to First Token (TTFT)
Measures how quickly a response starts streaming after a request is made — a key user experience metric.
Tokens consumption summary
Below the snapshot, you can explore detailed insights through the token consumption trend and model utilization views. These sections help you analyze how tokens are being used over time and how different models contribute to overall consumption.
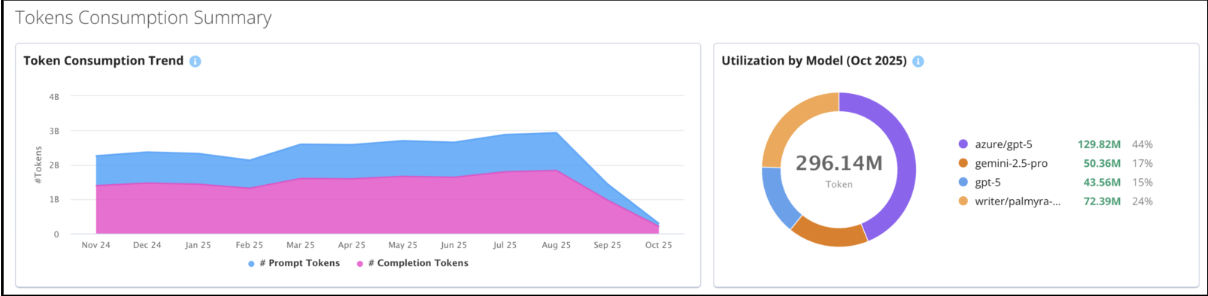
Token Consumption Trend
Displays the number of Prompt and Completion tokens consumed over time. Use this chart to:
Identify spikes in usage.
Correlate token peaks with engineering deployments, feature rollouts, or testing activity.
Monitor optimization progress when prompt efficiency changes are implemented.
Utilization by Model
Shows the proportion of total tokens consumed by each model (for example, azure/gpt-5, gemini-2.5-pro, writer/palmyra).
Use this data to:
Identify high-cost models driving spend.
Evaluate cheaper alternatives without sacrificing performance.
Align model usage with business and budget goals.
Cost Summary
Below the snapshot, you can explore detailed insights into token costs. Use the token cost trend to understand how expenses evolve over time.
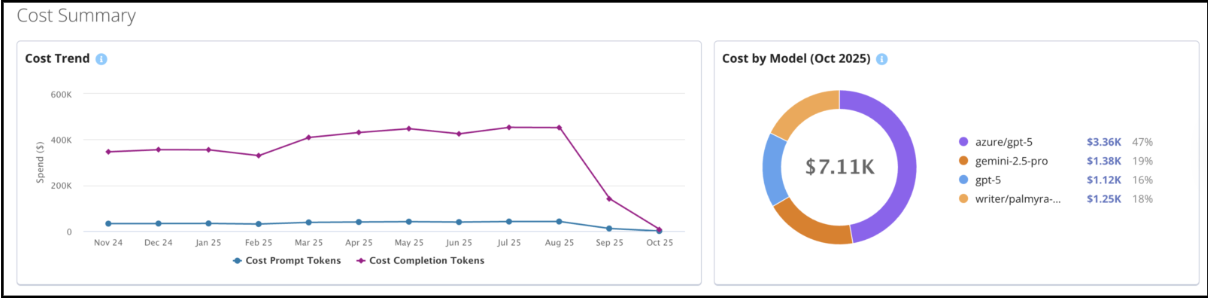
Cost views translate token usage directly into USD-based spend estimates.
Enables users to:
Reconcile token consumption with billing data.
Identify cost-heavy workloads and optimize prompts.
Apply rate limits or off-peak scheduling to minimize spend.
Select alternative models without sacrificing required performance.
Request Analysis
The Request Analysis view gives you a clear picture of how requests are distributed across different AI models and how those requests trend over time (see image above). Use this dashboard to quickly spot any unusual activity, such as sudden spikes in requests, which might mean a particular process or test is using up more resources than expected.
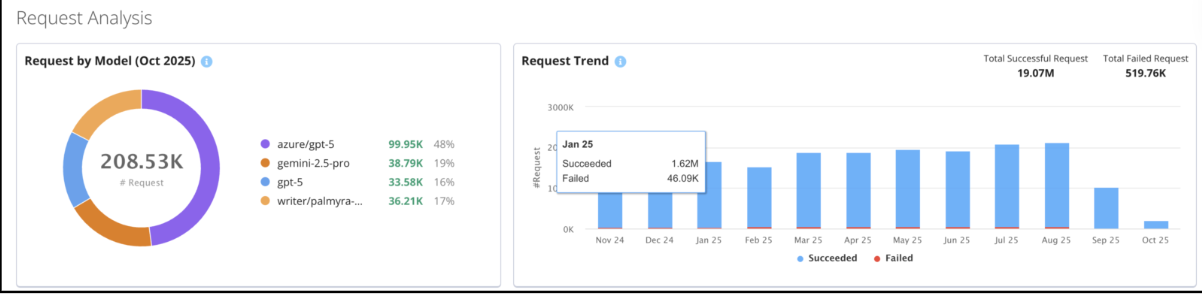
The Request Trend chart shows you how many requests succeed versus how many fail in each period. This helps you understand where resources might be getting wasted due to failed requests, so your team can take steps to lower unnecessary retries, save costs, and keep things running smoothly.
It’s a good idea to check this dashboard regularly. Reviewing wasted resource data helps you identify areas for improvement and track the impact of any changes you make to your system. This way, you can plan ongoing optimizations and see the return on investment (ROI) of your efforts.