What's new in Virtana?
Welcome to the release notes for Virtana. The visible and not-so-visible parts of Virtana are updated regularly. This page highlights the new features and enhancements.
This month's release includes enhancements in the following products:
This month's release includes the following enhancements:
Reports and Capacity Analytics
The following updates are available in Reports and Capacity Analytics:
A daily rate of change metric is now available for Capacity metrics and Capacity Analytics. Use this metric to determine the day-over-day rate of change for storage capacity.
A single report now supports two simultaneous timeframes.
The following data granularity options are now available for reports, in addition to the 1-hour granularity introduced in release 2026.4.1:
5 minutes
10 minutes
4 hours
1 day
For more information, see Reports
Nutanix
The Nutanix integration includes the following enhancements:
Support for Nutanix Prism Central as an integration source, and support for the Nutanix AHV V4 API.
Reporting of the operating system running on AHV virtual machines.
Relationship metadata that maps virtual machines to hosts in a Nutanix AHV cluster.
Alignment of metrics to time-based intervals.
Limitations of Nutanix Prism Central v4 Support:
Filtering to enable or disable metric collection for auto-discovered clusters is not supported yet.
Edit and delete actions for auto-discovered clusters are not disabled yet.
Some metrics listed below are not available through the Prism Central v4 API.
Entity Name
Metric Family
Metric Name
Nutanix Host NIC
Network Link Layer Throughput
Ethernet Avg Network Bytes Received Rate
Ethernet Avg Network Sent Byte Rate
Ethernet Avg Network Received Packet Rate
Ethernet Avg Network Sent Packet Rate
Ethernet Avg Network Received Error Rate
Ethernet Avg Network Sent Error Rate
Nutanix VM NIC
Network Link Layer Throughput
Ethernet Avg Network Bytes Received Rate
Ethernet Avg Network Sent Byte Rate
Ethernet Avg Network Received Packet Rate
Ethernet Avg Network Sent Packet Rate
Ethernet Avg Network Received Error Rate
Ethernet Avg Network Sent Error Rate
Nutanix Virtual Machine
Custom Nutanix VM Metrics
Memory Swapped In Rate (Bps
Memory Swapped Out Rate (Bps)
Nutanix Storage Node
Storage Capacity
Avg Used Effective Capacity
For more information, see Integrations
Hyper-V integration
The Hyper-V integration includes an improved workflow for deploying Hyper-V monitoring using import files.
For more information, see Integrations
SNMP Trap Receiver
An optional SNMP Trap Receiver is now available in the Infrastructure Observability (IO) alarm engine. The SNMP Trap Receiver supports the following capabilities:
Import of SNMP Trap definition files.
Processing of inbound traps and lookup of the sending device.
Correlation of traps to IO-monitored devices.
Automatic case generation.
Cases generated from IO-received SNMP traps can be sent to Global View for further action.
Public API
The Public API includes a new endpoint that returns version information for all installed integrations, including the version of the Public API itself.
NetApp
The NetApp integration now supports NAS Client IP conversation data by protocol. Supported protocols are SMB and NFS. Additional improvements to client conversation and operation data are planned for a future release.
For more information, see Integrations
Security and Core Component
With this release, several Infrastructure Observability core components have been updated to address security vulnerabilities and to bring them to the latest available versions. These updates to core components will continue for several release cycles.
Core OS Upgrade
With the 2026.6.1 release, an upgrade to the Core OS is generally available (GA). This upgrade is an in-place upgrade performed in the same manner as a standard IO update, using a UPD bundle uploaded to the IO instance. All future update bundles will include and apply the OS upgrade by default.
At this time, the OS upgrade is optional but recommended, as it will be required in a future release.
The following table describes the OS version applied by each upgrade bundle:
Upgrade Bundle | Target OS Version |
|---|---|
2026.4.1 | OpenSUSE 15.6 |
2026.6.1 | OpenSUSE 16.0 |
Note
For this release, a patch must be applied before upgrading from version 15.6 to 16.0. After the patch is applied, you can proceed with the upgrade to version 2026.6.1. If the IO OS version is earlier than 15.6, you must first upgrade to version 2026.4.1 (OS 15.6). For more information, refer to the detailed upgrade path chart.
A firmware release upgrading FC Probes to the new OS versions will be released separately.
Power Your AI Agents with IO Data
IO now provides a Model Context Protocol (MCP) server that integrates IO data into your AI workflows. The MCP server securely exposes real-time metrics, inventory, and schema data to your AI agents.
To get started, configure your LLM access in Settings > AI Configuration.
This month's release includes the following enhancements:
TracePath RCA enhancements
TracePath Root Cause Analysis (RCA) now supports three new capabilities to accelerate troubleshooting in complex environments:
Inter-cluster traffic analysis: RCA analysis now extends to traffic flows across clusters, helping you identify root causes in multi-cluster environments.
Image-change latency detection: RCA can now detect latency issues introduced by container image changes, giving you faster insight into deployment-related performance impacts.
Trend Matcher: A new Trend Matcher capability improves pattern-based RCA analysis and speeds up issue investigation by matching historical performance trends.
For more information, see Alerts.
Security vulnerability updates
This release updates vulnerable dependencies across key platform components to strengthen security. Updated components includes:
North Java, Python, and MongoDB modules, where CO north refers to the centralized server-side components.
South Metric and Log collectors, Gateways, and Exporters, where CO south refers to the agent-side components deployed on each monitored Kubernetes cluster.
Cluster-level policy editing
You can now edit the underutilized Pods Summary policy at the cluster level. This gives you greater control over cluster-wide resource optimization policies.
For more information, see Underutilized Pods Summary.
Namespace Summary Dashboard UX refresh
The Namespace Summary Dashboard has been refreshed with updated user interface enhancements for an improved experience.
Kubernetes headless service visibility
Kubernetes Headless Service information is now available on the Cluster Overview Dashboard, providing better visibility into service discovery within your clusters.
For more information, see Cluster Overview Dashboard.
Grafana Alloy as default log collector
Promtail has been replaced with Grafana Alloy as the default South-side log collector. Promtail is now deprecated.
Global View alerts as default alert view
The Global View alert screen is now the default alert view. The CO alert screen and related backend modules have been removed to provide a more streamlined and consistent alert experience.
For more information, see Alerts.
This month's release includes enhancements in the following products:
This month's release includes the following enhancements:
Show Logs in the Context of Alerts
Alert Details now include Logs alongside Topology, allowing users to view relevant logs and traces directly within an alert. This eliminates the need to switch tools, enables faster root cause analysis, reduces MTTR, and improves troubleshooting efficiency across supported entities such as VMware, network, storage, and syslog (where available).
To learn more, see Working with Alerts
Test Alert Intelligence and Response Policies (Sandbox)
A new Sandbox mode allows users to test alert policies against existing alerts before activation. Users can view matching alerts, validate action-specific criteria, and test alert responses (such as notifications). Sandbox testing is for validation only—policies apply only to new alerts once enabled.
To learn more, see Alert Intelligence Policies
Global View Alerts Dashboard – Widget Filtering by Integration
The Global View Alerts Dashboard now displays only the alert widgets relevant to the products integrated with Global View. For example, SO-only environments show only SO-related alert widgets, while IO- or CO-only environments display widgets specific to their respective integrations. This ensures a clearer, more relevant alert view without introducing new dashboards.
To learn more, see Alert Dashboard
SO Documentation Support in Copilot
Copilot is enhanced to answer user questions using Service Observability (SO) documentation. Existing SO docs are ingested into the Copilot knowledge base, enabling immediate support without waiting for the full documentation merge.
To learn more, see Service Observability Alerts by Systems
User Profile Default Landing Page Options for SO
Users can now configure a default landing page for Service Observability (SO) from their profile, selecting from supported static pages. Custom dashboards can also be offered as landing page options through a query-based mechanism. During onboarding, default landing page preferences can be synced from SO to Global View (GV) as part of customer migration.
To learn more, see Service Observability Alerts by Systems
Trace Topology Across Hybrid Infrastructure
Trace topology now supports visibility across hybrid environments, including both instrumented and un-instrumented services. Instrumented services provide detailed metrics, logs, and traces, while un-instrumented services are intelligently modelled within trace paths based on their interactions with monitored components. This delivers a more complete end-to-end view of service dependencies and system behaviour for improved troubleshooting and analysis.
To learn more, see Viewing Trace Services
Discover Jobs from Programs
This release introduces Discover Jobs from Programs, which provides centralised visibility into AI training workloads by automatically identifying and constructing training jobs from observed program activity. The feature discovers globally unique jobs when new programs are detected, copies relevant metrics from programs into the corresponding job, and establishes relationships with associated programs and GPU resources.
Custom Dashboards
This release introduces customizable dashboards that allow users to create and manage views of critical business performance, cost, and capacity metrics. Users can define dashboard names, select data sources (IO, CO, SO, GV), and configure filters, aggregations, and transformations to tailor insights to their needs.
To learn more, see Custom Dashboard
OVA-Based Deployment for Global View
This release adds support for OVA-based deployment of Global View to simplify onboarding for customers running virtualized environments. Users can now install and uninstall Global View as a virtual machine on OpenShift and Nutanix, reducing deployment complexity and accelerating time-to-value. The installation workflow automatically validates required prerequisites—such as namespaces and permissions—before proceeding, helping ensure a smooth and reliable setup.
To learn more, see Openshift Integration
This month's release includes the following enhancements:
Reports and Chart
In the Reports and Chart and UI areas, the following updates have been added:
Top N and Inventory Table charts: You can now filter data using a single metric. The supported filter operators are Above, Below, Equals, and In Between.
Entity Management: You can now delete custom properties. Before deletion, the system checks all instances to verify whether the custom property is currently in use.
To learn more, see Reports
Alarm
For the Alarm areas, the following updates have been added:
Single Metric Dynamic alarm rule type is now integrated with the new alarms engine. This rule type is available as a beta feature and is disabled by default. To enable it, install the histogramming service and turn on the feature using the appropriate UI service property. For detailed instructions, refer to the Single Metric Dynamic
Case Investigations: You can now manually delete old investigation documents and results. Additionally, a Delete if older than option has been added.
To learn more, see, Alarms and Cases
Pure Integration
The following enhancements have been added:
Network Interface Metrics: Ethernet CRC and Frame Error counts have been added.
Pure1 API: The Load Metric Max Value can now be retrieved from the Pure1 API.
Pure FlashArray: The Controller Mode attribute has been added.
Pure FlashArray Queues: Three new queue metrics have been introduced:
Queue_usec_per_mirrored_write_op
Queue_usec_per_read_op
Queue_usec_per_write_op
ProbeSW integration
The ProbeSW integration has been updated with new features:
A metric for the number of used and available ports per SAN Switch.
New Metrics added for SAN Switch Entity:
Total configured FC Ports
Online Ports
Free FC Ports
The above metrics are collected via SNMP.
An update to the All SAN Switch Entity Type to link the port usage metrics.
PowerMax integration
Starting with version 2026.4.1, PowerMax initiator names will be resolved to device alias or zone alias names.
This replaces the raw WWN-based identifiers with more meaningful names.
This name resolution is applied only when Cisco or Brocade switches are discovered in IO.
This name update happens every 24 hours. If the name is not updated on the day of install, then it will be updated the next day when the schedule runs again
Default WinRM Setting for Hyper-V
The com.vi.hyperv.winRM property is now enabled (true) by default. Since WinRM is required for the vast majority of Hyper-V installations, enabling it by default aligns with common deployment needs and helps reduce configuration issues and related support cases.
ProbeVM integration
In the ProbeVM integration for ESX, a Power-On status metric has been added for virtual machines and is now available at the ESX Host and ESX Cluster entity levels.
KVM Deployment Support
Added a supported deployment image for running Infrastructure Observability on KVM infrastructures. No functional changes were made to the existing KVM integration.
Nutanix integration
Support for Nutanix v4 (Prism Central) is provided as a beta release.
Security and Core Component Updates
With this release, several Infrastructure Observability core components have been updated to address security enhancements and align with the latest available versions. Updates to core components will continue across multiple release cycles. Core OS Upgrade: Starting with the 2026.4.1 release, the Core OS upgrade is generally available (GA). This is an in-place upgrade and is performed in the same way as a standard IO update, using a UPD bundle uploaded to the IO instance. All future update bundles will include and apply the Core OS upgrade by default.
Note
For this release, the Operating System Upgrade is contained in a separate release upgrade package that will upgrade the operating system and IO at the same time.
Automatic Job Discovery from AI Workloads
This release introduces unified “Job” visibility by automatically grouping related program executions into a single logical entity, enabling end-to-end tracking of AI training workloads. It provides consolidated metrics, timelines, and GPU associations at the job level to help you quickly identify failures, performance bottlenecks, and resource utilization trends.
Scheduling and Time Range Options for Reports
Added a new option as ‘Every Month First Day' in the ‘Run’ combo box. On selecting this, the reports will run on the first day of every month. Also, the “Previous Month’ option is added in the "Interval" combo box. On selecting this, the report time range will be the previous full month. Example: From 1st Day of Previous Month 12 AM to 1st day of current month 12 AM of appliance timezone.
To learn more, see Report
Power Your AI Agents with IO Data
New MCP Server: Integrate Infrastructure Observability with your AI workflows using the industry-standard Model Context Protocol (MCP).
Context-Aware AI: Securely expose real-time metrics, inventory, and schema data to your AI agents.
Quick Setup: Configure LLM access in seconds from Settings > AI Configuration.
To learn more, see AI Configuration
This month's release includes the following enhancements:
Grafana Alloy support for log collection
Container Observability now supports Grafana Alloy for log collection, replacing Promtail, which is being deprecated. This transition ensures continued reliability and performance for log ingestion workflows across CO South deployments.
Grafana Alloy for standalone Linux host data collection
Docker-based data collection on standalone Linux hosts has been replaced with Grafana Alloy. The updated installation script supports the following distributions:
RHEL (Red Hat, CentOS)
Debian (Debian, Ubuntu)
Cluster overview dashboard enhancements
Search and filter functionalities have been added for columns in the Cluster Overview dashboard, making it easier to locate and analyze specific cluster data.
Loki upgrade
Loki has been upgraded from v2.9.7 to v3.6 on both CO North and South deployments, bringing performance improvements and new capabilities.
Note
For CO North deployments, Loki's version_upgrade_date should be set to the next day after the upgrade and retained for up to one month.
This month's release includes enhancements in the following products:
Set SNMP receive traps
Configure the SNMP Trap Receiver to specify the port, SNMP version, and authentication settings that Infrastructure Observability (IO) uses to receive and process incoming traps from your network devices. IO supports SNMP v2c and three SNMP v3 security modes. The fields you complete depend on the SNMP version you select.
Go to Settings > SNMP Trap Receiver Settings.
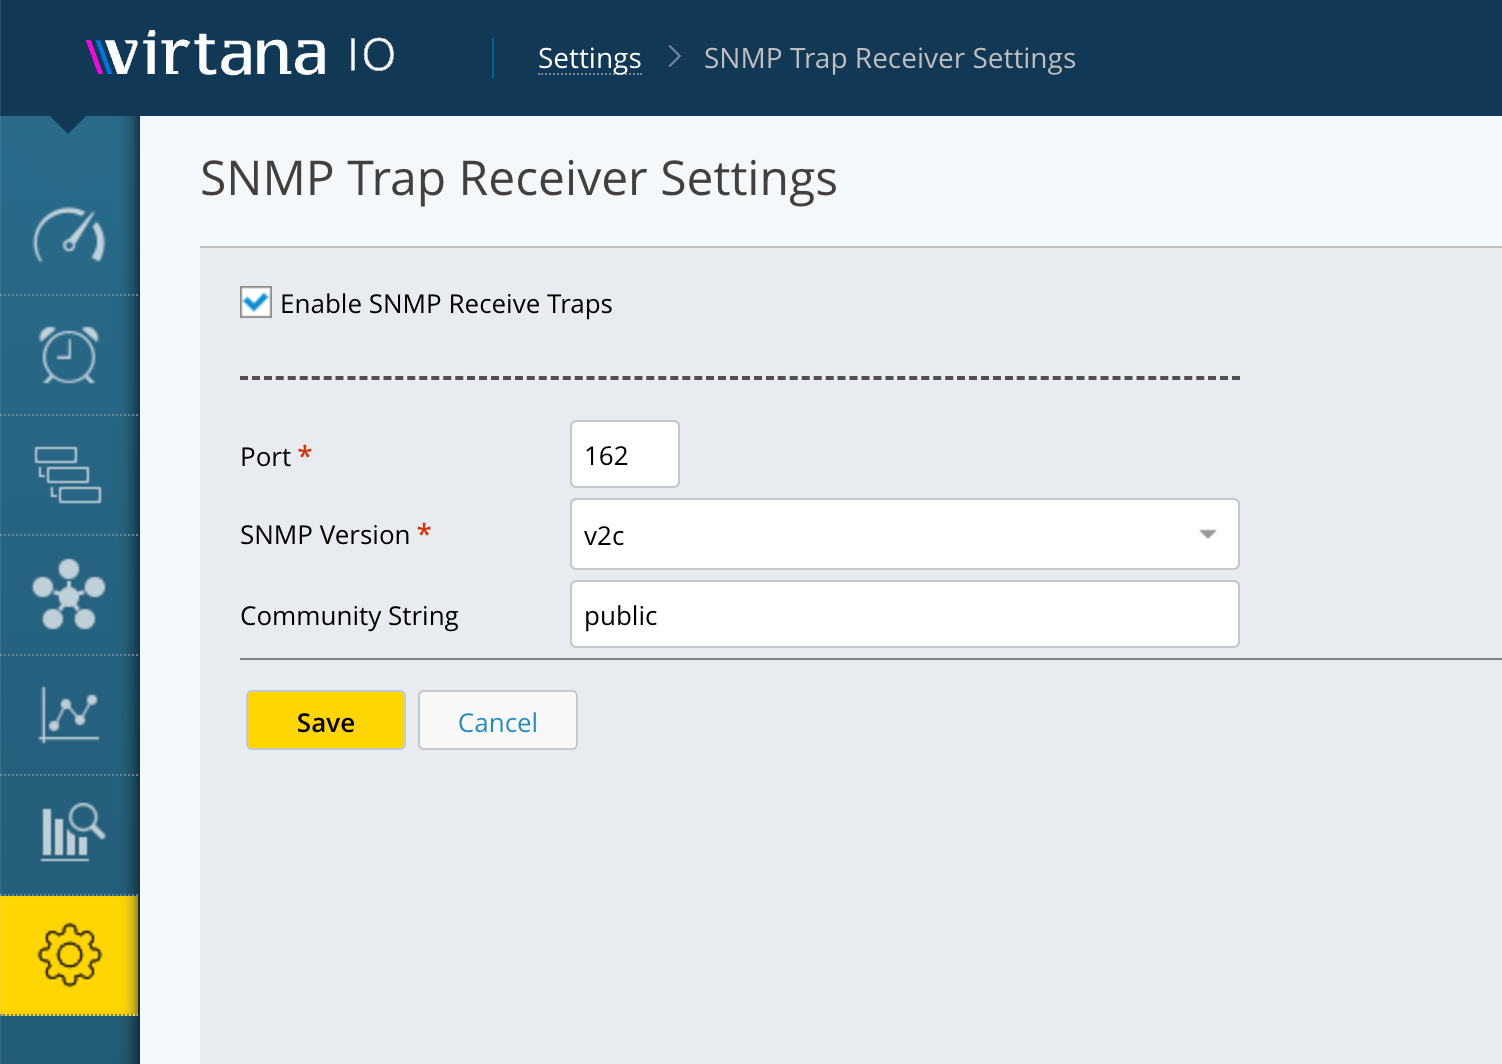
Select the Enable SNMP Receive Traps checkbox.
In the Port field, enter the UDP port number on which IO listens for incoming traps. The default is 162.
In the SNMP Version drop-down list, select the SNMP version that matches the version used by the devices sending traps. The following options are available:
v2c: Uses community string-based authentication. This is the default and simplest option. Use this if your devices support SNMPv2c.
v3 No Auth No Privacy: Uses a username only, with no authentication or encryption. Use this only if your devices do not support authentication.
v3 Auth No Privacy: Uses a username and authentication, but no encryption. Use this if your devices support SNMPv3 authentication but not encryption.
v3 Auth Privacy: Uses a username, authentication, and encryption. This is the most secure option. Use this if your devices support SNMPv3 with full security.
If you selected v2c, enter the community string configured on the devices sending traps in the Community String field. The default is public.
Note
For v3 security modes, additional authentication and encryption fields are required. Contact Virtana Support if you need guidance on completing these fields for your environment.
Click Save. IO begins listening for incoming SNMP traps on the configured port. When IO receives a trap, it translates it using your uploaded MIB files and opens a case for the source device.
IO begins listening for incoming SNMP traps on the configured port. When IO receives a trap, it translates it using your uploaded MIB files and opens a case for the source device.
Welcome to the Virtana Infrastructure Observability (IO) 2026.2.1 release!
This release includes updates to several core components, providing security enhancements and bringing them to their latest versions. These core component updates will continue for several releases.
Additionally, this release includes the following enhancements:
Reports and Charts updates
In Reports, Stacked Bar charts are now available as a chart type for the Top N chart family. You can select a specific granularity for individual charts when rendering graphs. The selected granularity applies only to the configured chart, enabling multiple charts within the same report to use different granularity levels.
Alarm configuration updates
We've made two improvements to the Alarms > Rules feature:
Easier rule setup with duplication: If you need a new alarm rule that is similar to an existing one, you can now use the new Copy Rule option to instantly duplicate any rule. It automatically copies the entity, metric, and evaluation settings, allowing you to make small, necessary adjustments before saving the new rule.
A clearer, more informative interface: The Alarms > Rules screen has been updated for better readability and information display. You can now see details such as configured metrics, threshold values, and evaluation time windows on the main screen, which simplifies quick reviews. Additionally, you can easily export this rule data to a CSV file or copy it to your Clipboard.
Enhanced integrations
We've improved several integrations by adding new attributes and metrics:
NetApp ONTAP: Share-level inode metrics have been added.
Linux: Now includes a new Committed Memory metric and timeout flags for command sets.
The Version property is now available for the following integrations:
IBM Modular (Cluster, Node, Controller)
NetApp (Cluster, Array)
Dell PowerScale (Array, Cluster)
Dell PowerStore (Cluster, Appliance)
New Uptime metric
The Uptime metric has been added for:
Infinidat (Array)
Pure FlashArray
Dell PowerScale (Cluster, Array, Node)
Dell PowerStore improvements
We've added CPU Utilization and Caching Media metrics.
HPE Primera and Alletra updates
Capacity-related metrics have been updated, and aggregation logic has been refined for better alignment with native UI values.
Note for VMAX/PowerMax users:
When using VMAX/PowerMax Unisphere version 10.0 or later, the following property values are no longer available:
Total Allocated Capacity
SRP SLO Demands
SRP Storage Group Demand
This month's release includes the following enhancements:
Trace Topology
The new trace-based topology view lets you focus on a specific service and visualise its direct and indirect interactions across your hybrid environment (on-premises and cloud). This makes it easier to understand service dependencies, troubleshoot issues, and analyse request flows.
Trace RCA Alerts
Introduces a new alert type with built-in root cause analysis (RCA) for application performance issues. Trace RCA Alerts correlate distributed traces with related logs and infrastructure metrics to identify the root cause of application slowdowns accurately.
Idle Kubernetes Pods
Adds a new widget to the Cluster Overview Dashboard that highlights underutilised Kubernetes pods, helping optimise resource usage.
This month's release includes enhancements in the following products:
This month's release includes the following enhancements:
Enhanced Smart Alert Search
Global alert search is now case-insensitive for improved accuracy and usability. Now supports multi-field querying, full-sentence searches, and the use of * wildcard patterns, making it much easier and more flexible for you to discover and filter alerts based on summary, entity name, application name, tags, and related entities. See Alerts to view in detail.
Enhanced Copilot for Intelligent Alert Policy Generation
Improved NLP models for more accurate auto-generation of alert intelligence and response policies.
Copilot better interprets user intent, criteria, and entities, producing policies that closely match operational requirements.
Enhanced guidance and validation for higher-quality, ready-to-use policies with less manual adjustment.
For more details, see Generate Policy with Copilot in Alert Intelligence and Generate Policy with Copilot in Alert Response.
Dark Theme Support
Full Light and Dark theme support, including new design tokens for colors, typography, spacing, shadows, and component styles.
Theme toggle in the user menu, with user preference persistence across sessions.
Consistent, accessible, and UX approved visuals in both themes.
Display IO Appliance Last Data Collection Time
The Global View interface now displays the last data collection time for IO appliances.
CO Alerts Metric Graph Unit Conversion Enhancement
Improved unit conversion for metric graphs in Container Observability alerts.
OOB Action Workflow
Volume resizing through StackStorm action is now supported as an out-of-the-box workflow.
Welcome to the Virtana Infrastructure Observability (IO) 2025.12.1 release!
This release includes updates to several core components, providing security enhancements and bringing them to their latest versions. These core component updates will continue for several releases.
Additionally, this release includes the following enhancements:
New metrics for Hitachi Content Platform
Several new properties and metrics have been added to the Hitachi Content Platform (HCP) Integration, focusing on the Node, Tenant, and Namespace areas.
For more information, see the HCP 1.0 Metrics Guide, which you can download in the Virtana Support Portal
New metrics for Hitachi NAS System Integration
Several new metrics have been added to the Hitachi NAS System Integration, focusing on Object Storage Replication.
For more information, see the Hitachi NAS 1.1 Metrics Guide, which you can download in the Virtana Support Portal.
Updated features for Hitachi VSP Integration
The Hitachi VSP Integration has been updated to provide discovery and metric collection for Journal Groups and Consistency Groups.
For more information, see the Hitachi VSP Metrics Guide, which you can download in the Virtana Support Portal:
New entities added to Dell Unity Integration
This update significantly expands the Dell Unity Integration by introducing several new entities: Disks, LUNs, Pools, VVols (both File and Datastore), NAS Server, and the array itself. Furthermore, metric updates have been implemented to include capacity, performance, and utilization data for specific entities, along with the addition of new properties.
For more information, see the Dell Unity User Guide, which you can download in the Virtana Support Portal
New metrics for Dell PowerMax Integration
The Dell PowerMax Integration now includes updated metrics and properties, encompassing Disks, Disk Groups, Volumes, and SFPs. Because of the potentially large number of elements that might be configured on each array, the discovery and collection of metrics for Disks, Disk Groups, and Volumes is disabled by default.
For more information, see the Dell PowerMax Metrics Guide, which you can download in the Virtana Support Portal.
New properties for Cisco SAN Switches
The SAN Switch Integration now collects additional SFP properties, specifically SFP Inventory and Part information, from Cisco SAN Switches. This collection is achieved using the NX-API interface, which must be enabled on the switches.
For more information, see the Infrastructure Observability 2025.12.1 Metrics Guide, which you can download in the Virtana Support Portal.
New features in the Public API
The Public API has been updated with several new features:
New filtering options, including Case Insensitivity, Starts With, Ends With, and Contains. Regex (regular expression) filtering is available, but disabled by default.
Output options for API Data Queries now includes a Top N Table option.
Credential Update endpoints for Brocade and Cisco Fibre Channel Switches.
New editing, importing, and exporting updates in Alarm Configuration
You can now bulk-edit alarm rules and export/import alarm rules.
You can now bulk-edit alarm rules in the user interface for the following areas:
Set Severity
Enable/Disable Rule
Enable/Disable SNMP Notifications
Add/Remove Email Notifications
Add/Remove Defined Actions
Additionally, you can export and import alarm rules in the user interface. This is similar to the existing Export/Import feature in Report Templates.
New options in Reports And Charts
Reports And Charts features the following enhancements:
In reports, you can now select a custom time range, including a specific number of days, hours, and minutes. This custom time selection is applied across the entire report, including all charts in the report.
When scheduling a report, select the new 'Run Now' option to immediately generate and send a test report. This ensures the report is created and delivered correctly to all configured email recipients.
New Property Added for VMware
The system now discovers and captures MAC addresses for both Ethernet and virtual Ethernet ports as a new property. This MAC address data is leveraged to visualise the complete end-to-end IP topology - from the ESX host to storage, traversing switches and switch ports - providing a comprehensive view of network connectivity.
Security and Core Component Updates
Several Infrastructure Observability core components have been updated to:
Apply security patches
Upgrade to latest versions
These core updates will continue across multiple release cycles.
This month's release includes the following enhancements:
Confluent Cloud Support
You can now extend your Azure Cloud integration to include observability for environments using Confluent Cloud. This enhancement enables you to monitor and analyze your Confluent Cloud workloads alongside your existing Azure resources, giving you a unified view of your streaming data infrastructure. For more information, see Collect Confluent Cloud on Microsoft Azure.
New Dashboards for Kafka and JVM
Virtana introduced new dashboards specifically designed for Kafka and JVM. These dashboards provide deeper insights into your Kafka clusters and JVM-based applications, helping you quickly identify issues, optimize resource usage, and ensure your applications run smoothly.
Visualize key Kafka metrics, such as broker health, topic throughput, and consumer lag.
Monitor JVM performance indicators, including memory usage, garbage collection, and thread activity.
You can proactively address performance bottlenecks and maintain high availability for your critical services.
Self-Monitoring Improvements
Virtana has enhanced cluster health monitoring to give you a clearer picture of how your Virtana instance is performing. Improved self-monitoring tools provide actionable insights into system health, helping you maintain optimal performance and quickly address any issues.
Container observability in Dark Mode
Virtana Container Observability now supports the new Virtana Dark Theme. You can switch to dark mode for a more comfortable viewing experience, especially in low-light environments.
This month's release includes enhancements in the following products:
This month's release includes the following enhancements:
Cost meter cards are improved
These improvements make it easier for you to understand both raw and effective capacity usage so you can better track consumption, optimize resources, and plan more accurately.
You can do the following with Cost meter cards:
Meter card management: You can define meter cards granularly based on Infrastructure Observability (IO) instances and hosts.
Enhanced storage capacity visibility: The newly expanded capacity reporting provides you with a clear picture of storage utilization. Along with Actual Used Capacity and Actual Free Capacity, you can view Compressed Values, which provides visibility into post-compression savings for environments using storage efficiency features.
To learn more, see Creating Cost Meter Cards.
Topology updates
The Topology feature is updated with the following improvements:
Clustered resource view: You can now view resources in a clustered set on the Topology page, providing a more organized overview.
Expanded filters: You can now select up to 10 resources within the filter.
Entity-specific drill-down: You can now drill down into the topology of specific entities for more focused analysis.
Kubernetes resource hierarchy: You can now view Kubernetes (K8s) resources in a hierarchical structure, improving clarity and understanding of relationships.
Automated connectivity discovery: Connectivity between cloud and on-premise resources are automatically discovered, providing a more complete picture of your infrastructure.
Root cause analysis in Global View
You can now better perform root cause analysis for service level objectives (SLO) alerts in Global View by showing how services are communicating with each other.
Welcome to the Virtana Infrastructure Observability (IO) 2025.9.1 release!
This release includes updates to several core components, providing security enhancements and bringing them to their latest versions. These core component updates will continue for several releases.
Additionally, this month's release includes the following enhancements:
API updates
Single API for inventory data
Added a new API to provide inventory data for various compute and storage entity types, for example, All Compute Hosts, All IP Switches, and All Storage Arrays. This initial release makes available the same metrics currently displayed in Virtana IO.
Virtana IO API improvement
The Virtana IO API is now case-insensitive. Previously, the API contained upper and lower case sensitivity. This improvement now makes it easier to match on hostnames and new endpoints.
For more information, see the Public API documentation.
New metrics for Brocade Fiber Channel (FC) switches
Additional and updated metrics and properties are now in the Fiber Channel Switch Integration for Brocade FC Switches. These changes include updates for environmental details, such as temperature and fan speed.
The following metrics have been added to support Brocade FC switches. These include:
system.fan.speed: Monitors the current fan sensor reading.
brocade.san.switch.power.supply.value: Monitors the current power supply sensor reading.
system.temperature.value: Monitors the current temperature sensor reading.
For more information, see the Infrastructure Observability 2025.9.1 Metrics Guide, which you can download in the Virtana Support Portal.
New environmental metrics for Cisco Fiber Channel (FC) switches
Additional and updated metrics and properties are now in the Fiber Channel Switch Integration for Cisco FC Switches. These changes include updates for environmental details, such as sensor status, temperature, and fan speed.
The following metrics have been added to support Cisco FC switches:
cisco_entity_physical_sensor_airflow: Represents an Entity Cubic Meters per minute (airflow) Sensor value.
cisco_entity_physical_sensor_electric_current: Represents a Cisco Entity Electric Current Sensor value.
cisco_entity_physical_sensor_electric_potential_ac: Represents a Cisco Entity Electric Potential AC Sensor value.
cisco_entity_physical_sensor_electric_potential_dc: Represents a Cisco Entity Electric Potential AC Sensor value.
cisco_entity_physical_sensor_frequency: Represents a Cisco Entity Frequency Sensor value.
cisco.fru.total.availablecurrent: Total current available for FRU usage.
cisco.fru.total.drawncurrent: Total current drawn by powered-on FRUs.
cisco_entity_physical_sensor_relative_humidity: Represents a Cisco Entity Relative Humidity(RH) Sensor value.
cisco_entity_physical_sensor_rpm: Represents a Cisco Entity RPM Sensor value.
cisco_entity_physical_sensor_Rx_Tx_power: Provides the Rx_Tx power value.
cisco_entity_physical_sensor_temperature: Represents a Cisco Entity Temperature Sensor value.
For more information, see the Infrastructure Observability 2025.9.1 Metrics Guide, which you can download in the Virtana Support Portal.
New environmental metrics for Linux OS Integration
Additional metrics and properties have been added to the Linux Integration, including filesystem utilization, message queues, memory, swap, and semaphore properties and metrics.
The following metrics have been added to support Linux OS integration:
system.disk.inode.utilization
system_linux_individual_SwapArea_Utilization
system_linux_loggedInUsers_Pct
system_linux_messageQueueIDs_Utilization
system_linux_openFileDescriptors_Utilization
system_linux_runningProcesses_Pct
system_linux_Semaphores_UsedCount
system_linux_Semaphores_Utilization
system_linux_sharedMemoryIDs_Utilization
For more information, see the Linux Operating System 3.2 Metrics Guide, which you can download in the Virtana Support Portal.
New metrics for Hitachi Content Platform
New properties and metrics have been added to the Hitachi Content Platform (HCP) Integration. These additions enhance the Node, Tenant, and Namespace areas.
The following metrics have been added to support HCP:
HCP Node
type
hardware_type
failure_status
Label
Volume
System Name
Serial Name
Compression %
version
replication_enabled
search_enabled
indexed_Volume_Capacity
shared_volume_capacity
Licensed_Capacity
HCP Tenant
Allow_search
allow-versioning
allow_replication
allowRetentionModeSelection
HCP NameSpace
Soft Quota
For more information, see the HCP 1.0 Metrics Guide, which you can download in the Virtana Support Portal.
New metrics for Hitachi NAS System Integration
Several new properties and metrics have been added to the Hitachi Network Attached Storage (NAS) System Integration. These additions focus on networking status and metrics, and include metrics for File Transfer Protocol (FTP), Common Internet File System (CIFS), Server Message Block (SMB), Network File System (NFS), Internet Small Computer System Interface (iSCSI), and ethernet.
For more information, see the Hitachi NAS 1.1Metrics Guide, which you can download in the Virtana Support Portal.
New metrics for Windows OS Integration
New properties and metrics have been added to the Windows OS Integration, including Memory, Event Log Counts, and Volume Serial Number.
For more information, see the Windows Operating System 3.1 Metrics Guide, which you can download in the Virtana Support Portal.
New SFP metrics for Cisco SAN switches
The SAN Switch Integration now support Small Form-Factor Pluggable (SFP) metric data on Cisco Storage Area Networking (SAN) switches, including light levels, power, and temperature. To collect these metrics, you must enable the NX-API interface on the switches.
For more information, see the Infrastructure Observability 2025.9.1 Metrics Guide, which you can download in the Virtana Support Portal.
New! Dell PowerProtect Integration
The new Dell PowerProtect Integration supports customers who use the Dell PowerProtect line of systems in their infrastructure. You can use this integration to help discover hardware components, construct topology views, and deliver data on the health, utilization (including capacity), and performance of these components.
This release supports properties and metrics for hardware configuration, health, utilization performance and capacity of the systems.
For more information, see the new Dell PowerProtect guides which you can download in the Virtana Support Portal.
New! Alarm engine redesigned
The redesigned Infrastructure Observability Alarm Engine is now available for testing. This updated engine can be installed and run in parallel with the current alarm system, which you can turn on using a specific property. This alarm engine focuses on Single Metric alarms that can use Properties as an evaluation source.
As a best practice, only use this updated alarm engine in lab or testing environments.
This month's release includes the following enhancements:
Amazon CloudWatch for Amazon FSx integration
The Amazon CloudWatch for Amazon FSx integration automatically discovers Amazon FSx for NetApp ONTAP instances using AWS credentials. It then ingests CloudWatch metrics into Global View, where they appear alongside existing IO-collected NetApp metrics.
Here's how it works:
Automated discovery: Cloud Gateway uses your AWS credentials to automatically find all FSx instances in your AWS environment, eliminating the need for manual setup.
Comprehensive metrics: We combine IO's in-depth NetApp expertise (ONTAP-level metrics) with CloudWatch's infrastructure metrics (cache hit ratios, AWS-specific performance data) for a complete, unified view.
Centralized alerting: FSx alerts from both sources are consolidated in Global View's alert dashboard, ensuring proper correlation and context.
Seamless integration: The solution uses your existing IO-to-Global View connectivity, requiring no changes to your current workflows.
This feature is available to existing Virtana customers with AWS FSx for NetApp ONTAP deployments who can provide AWS credentials for CloudWatch access and configure the integration using Cloud Gateway.
Google Kubernetes Engine (GKE) Autopilot cluster support
Virtana is now recognized as a Google Autopilot partner, so you can deploy Virtana Container Observability on Google Kubernetes Engine (GKE) Autopilot clusters. This deployment provides comprehensive visibility into dynamic, containerized workloads running on GKE Autopilot.
For more information, see Deploy Virtana CO South on GKE Autopilot clusters.
Improved download support
You can now export your Kubernetes data to a PDF or CSV file. Previously, you could only export the data that was displayed in the window.
This month's release includes the following enhancements:
Virtana Web Analytics
Admins can now access a unified dashboard that delivers deeper insights into how teams are using the Virtana Platform, including Container Observability. This dashboard tracks user logins, time spent within the platform, and the most frequently accessed features, so decision-makers can assess adoption and measure return on investment.