Actions
Introduction
Actions are an integral part of the monitoring ecosystem, where problems and issues are addressed and resolved.
The IO supports the full lifecycle management of action configurations, including Create, Read, Update, and Delete (CRUD) operations. Each operation includes specific steps that interact with user interface elements.
Create an Action Configuration
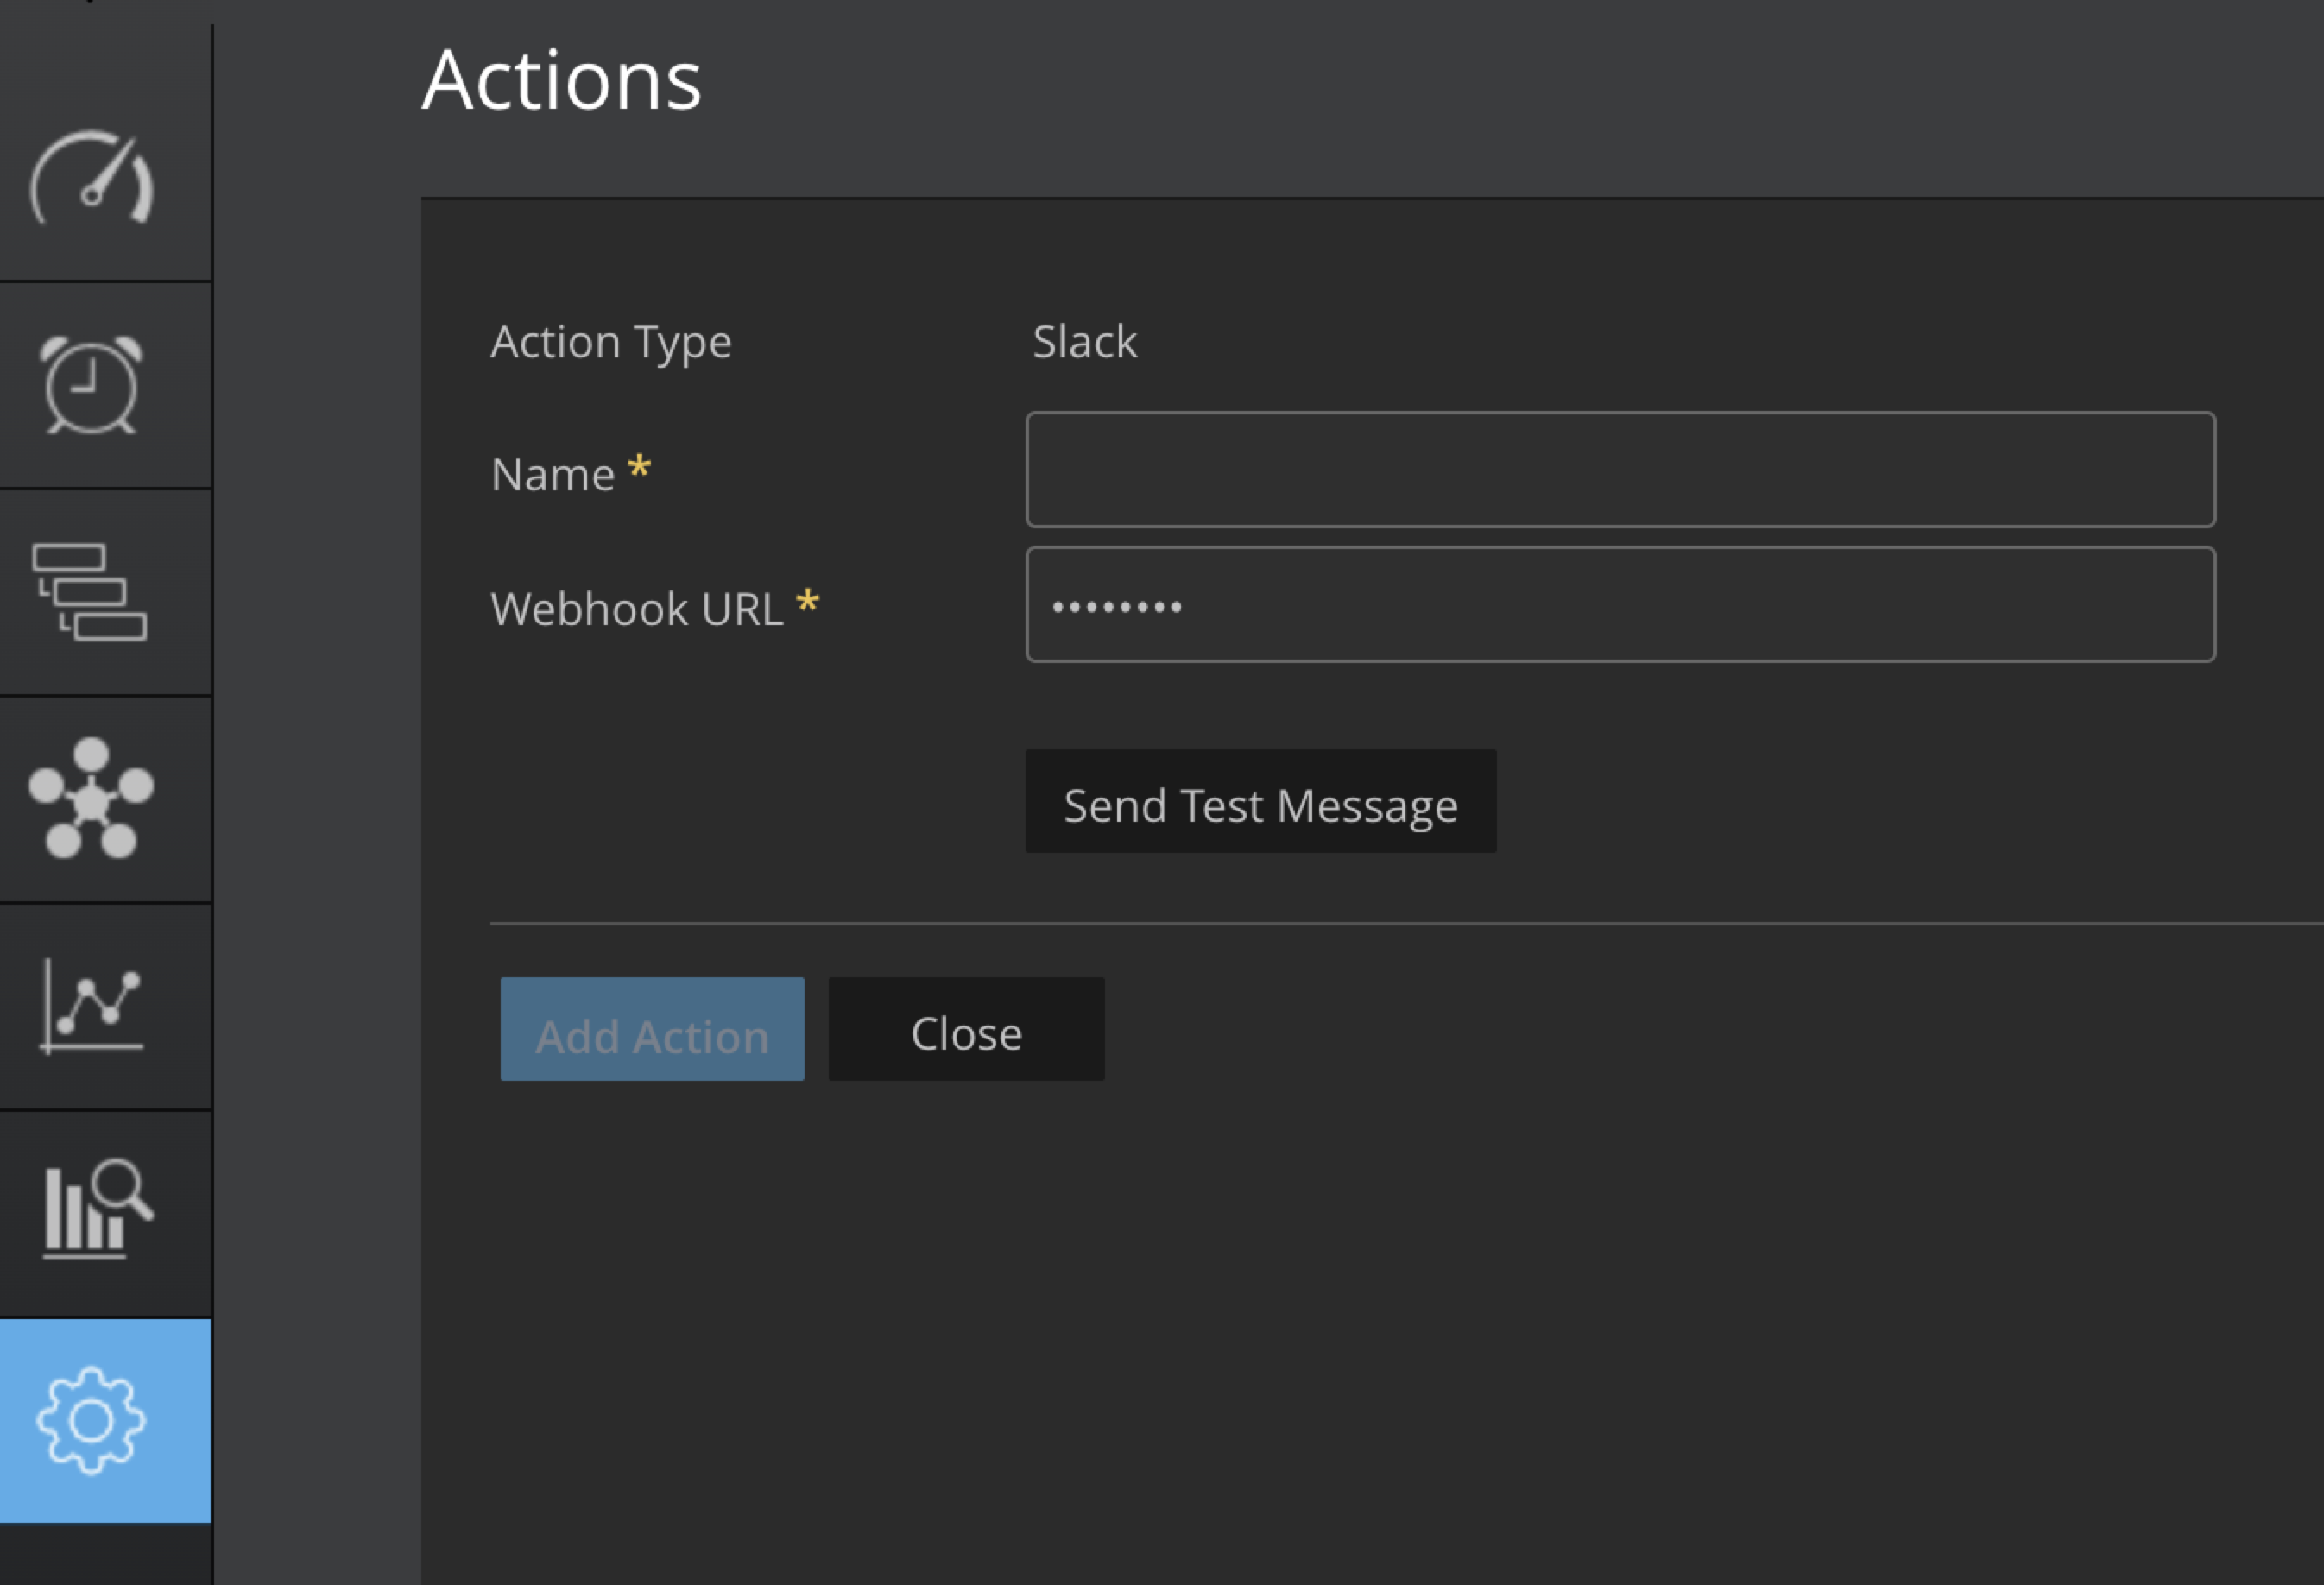
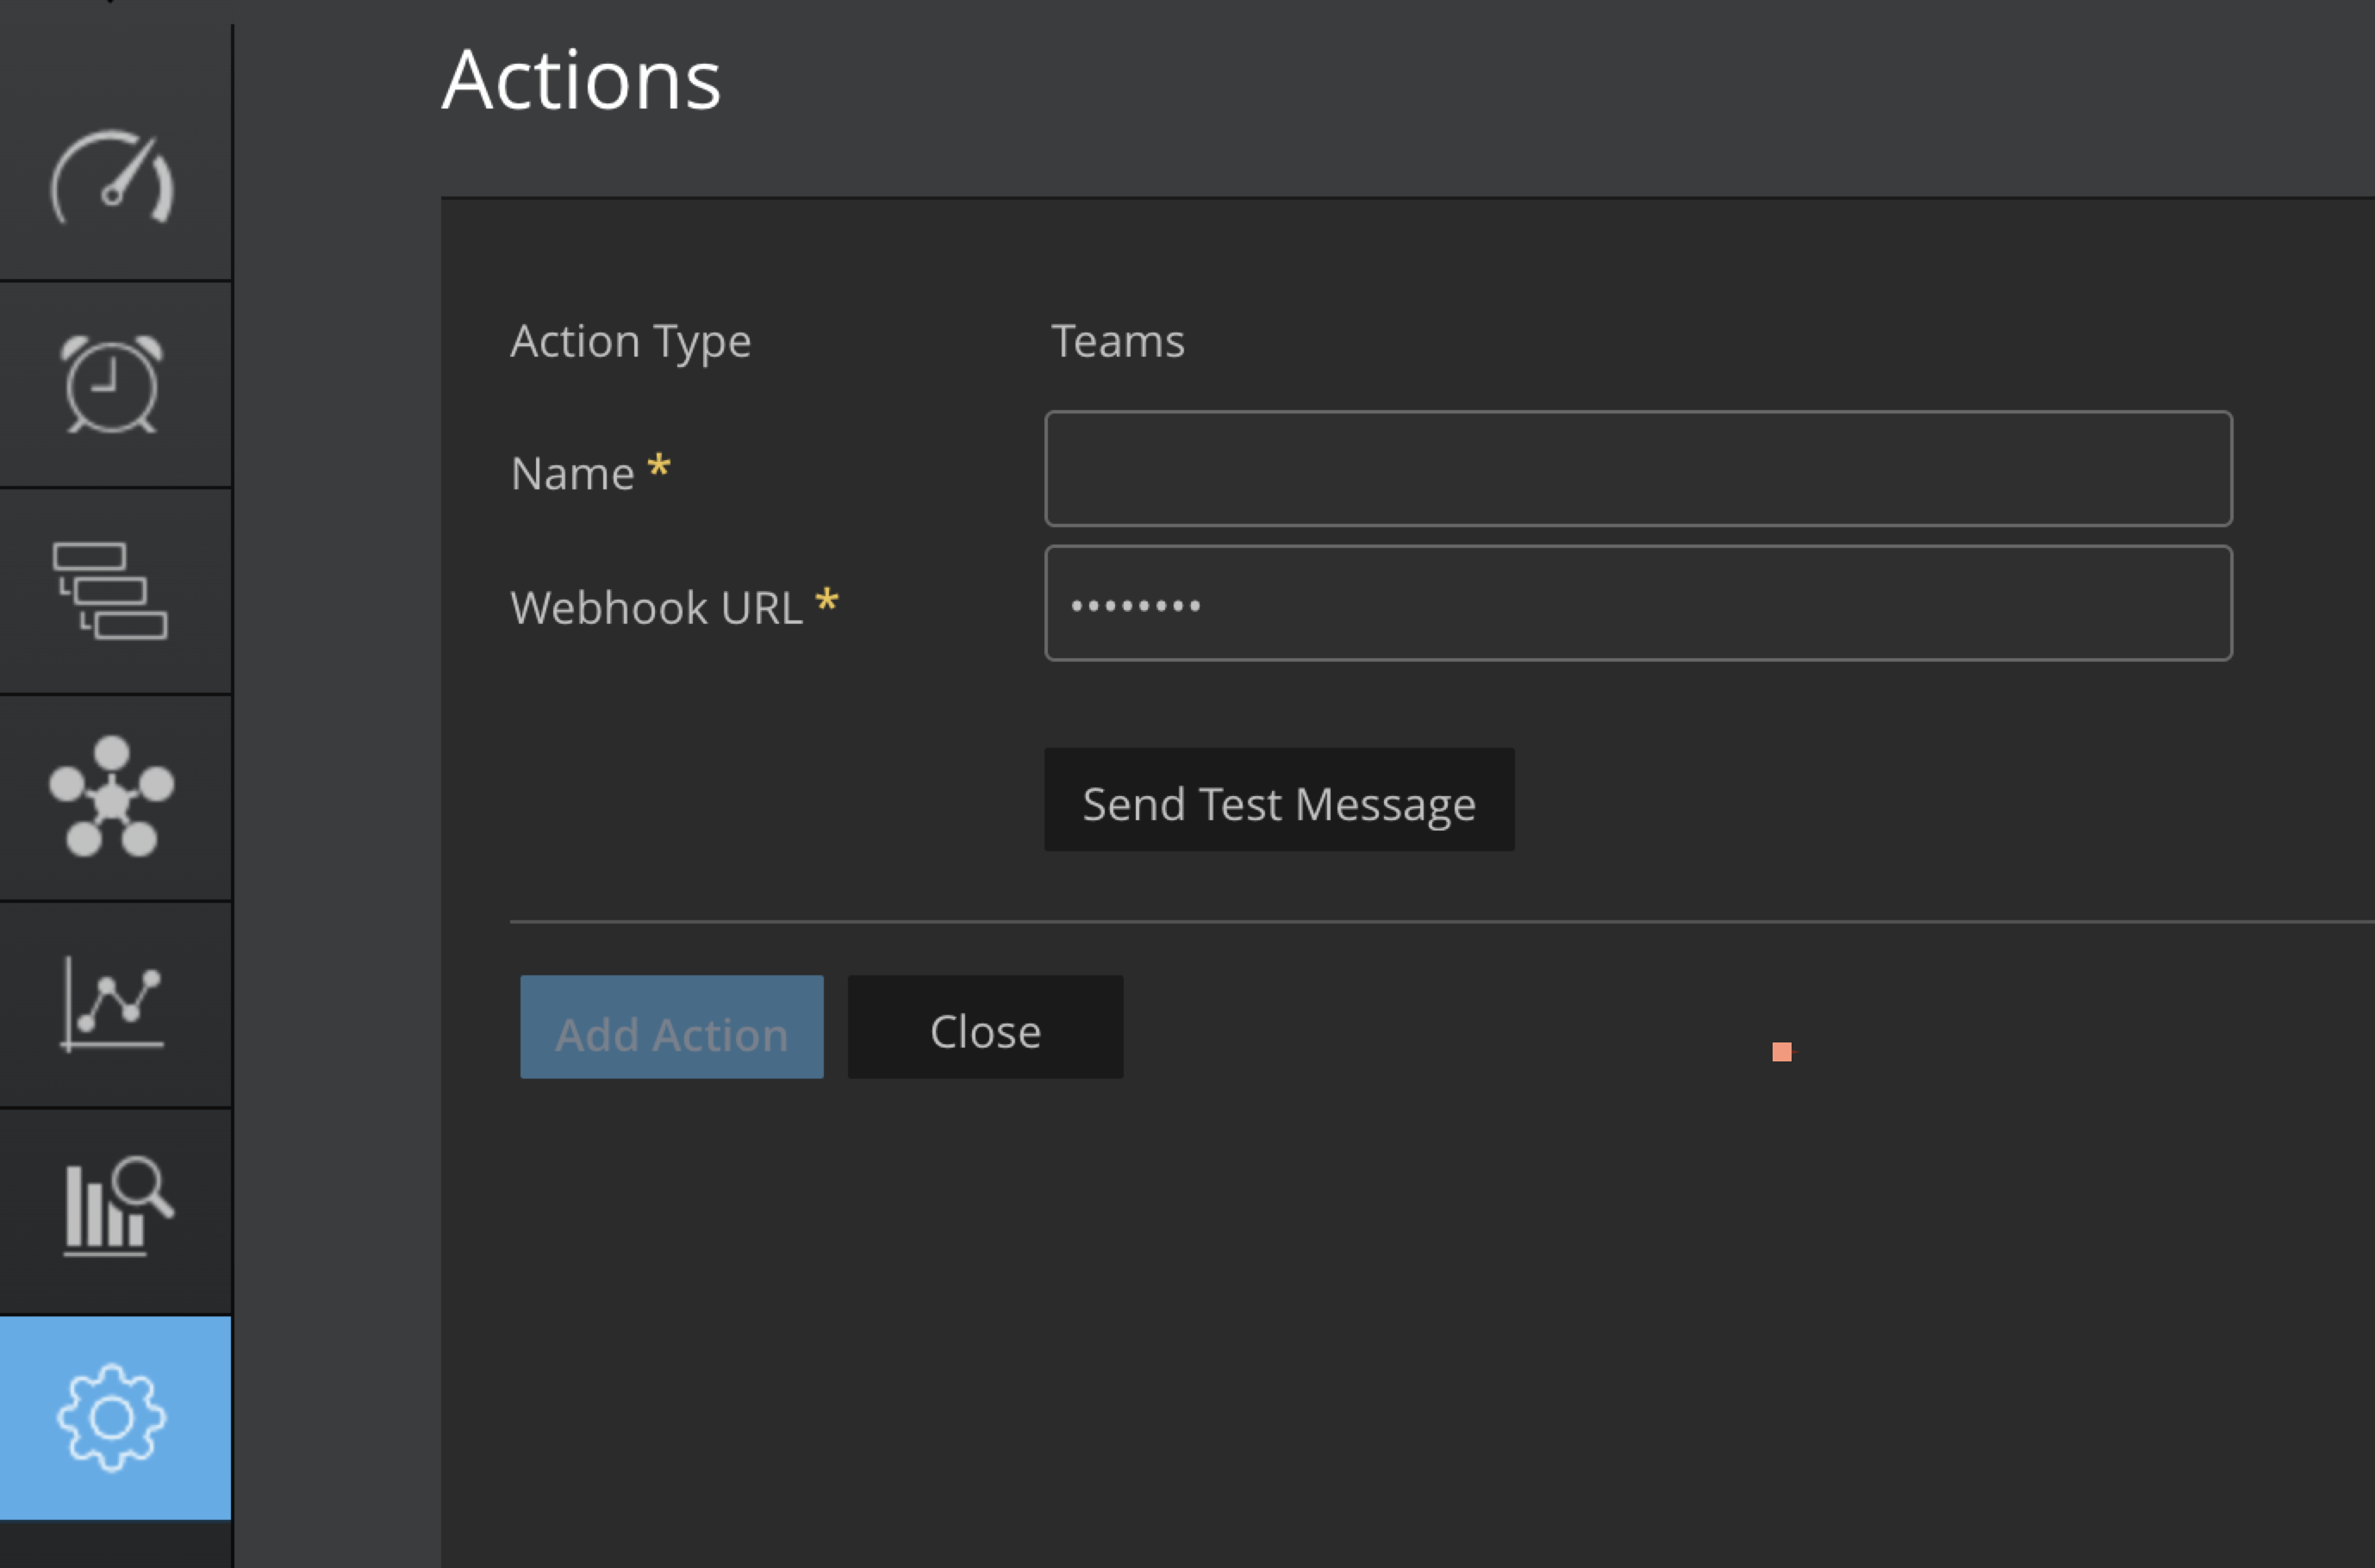
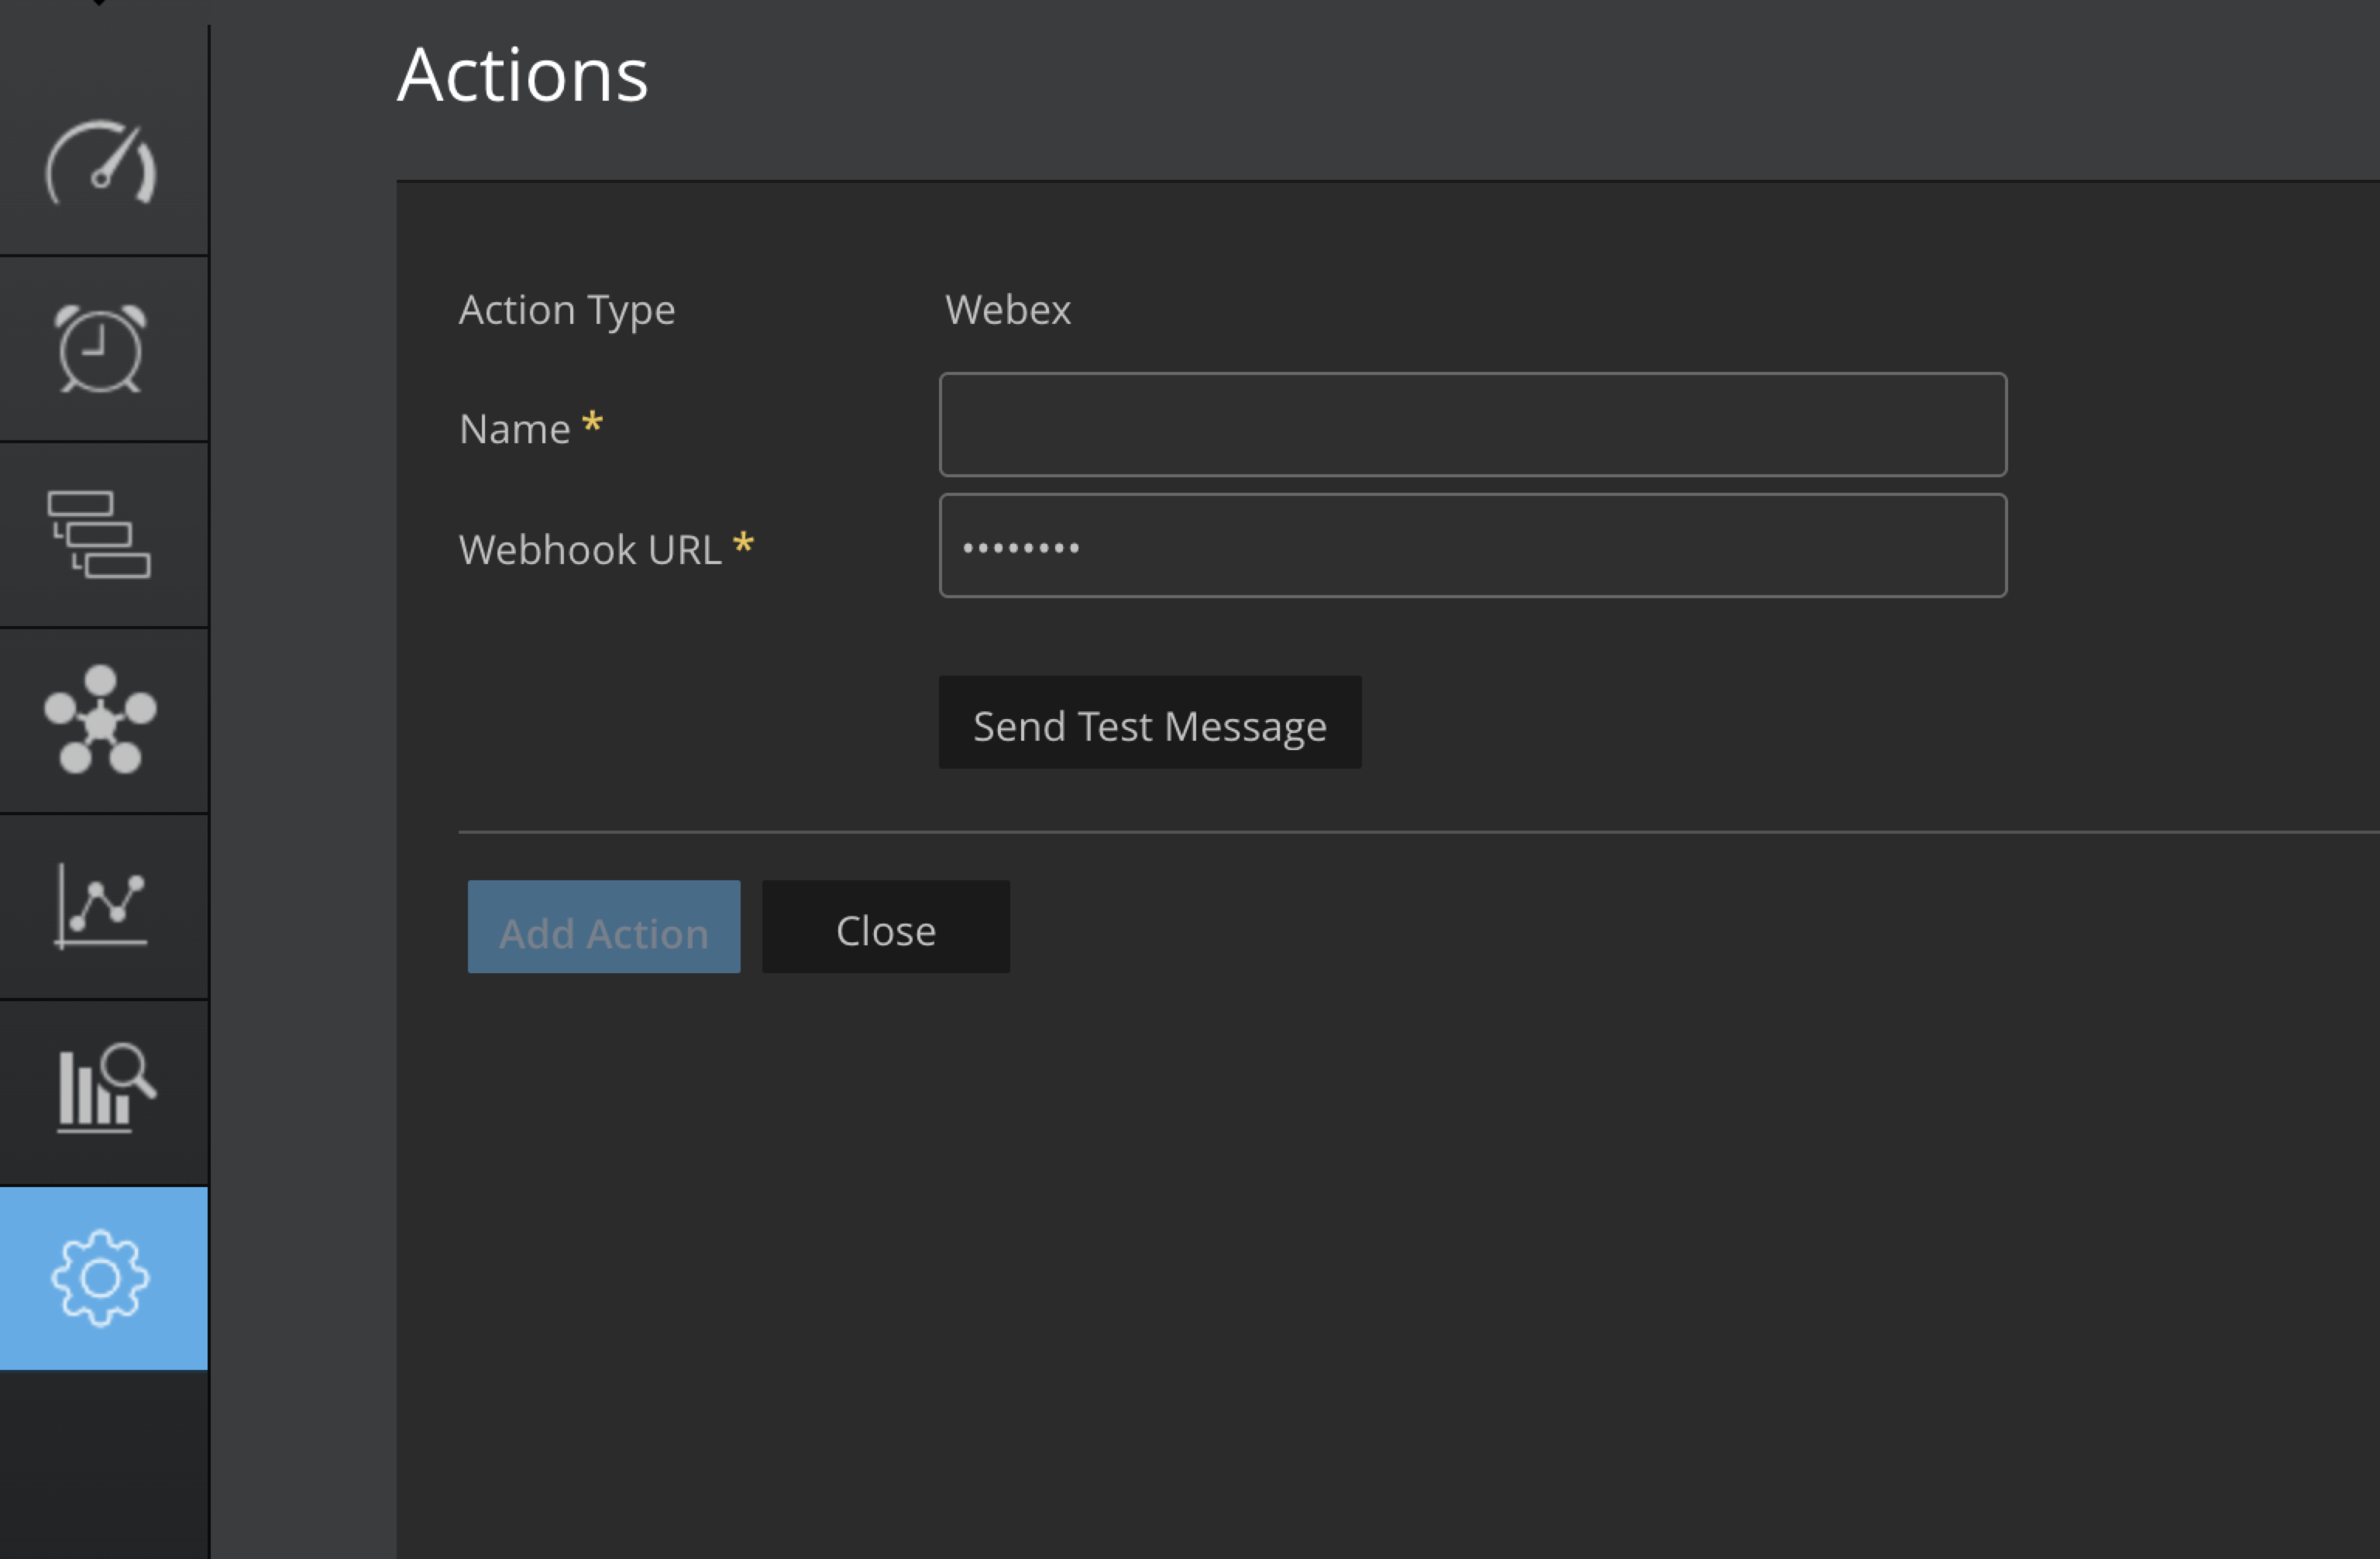
Navigate to Settings > Actions Configuration.
Click on the Add Action button. Select the action type from the drop-down menu.
You can select actions such as Slack, MatterMost, Teams, Https, and WebEx
Enter the Name in the Name input field.
Enter the Webhook URL in the Webhook URL input field.
To test if the webhook URL is correct, click on Send Message.
Click Add Action to save.
Update Action Configuration
Locate an existing action configuration in the list.
Click the Action Name in the row go to the edit configuration.
Update the necessary fields, for example, Name, Webhook URL.
Click the Save button.
Delete Action Configuration
Locate an existing action configuration in the list.
Click the Delete icon next to the configuration.
In the confirmation dialog, click OK.
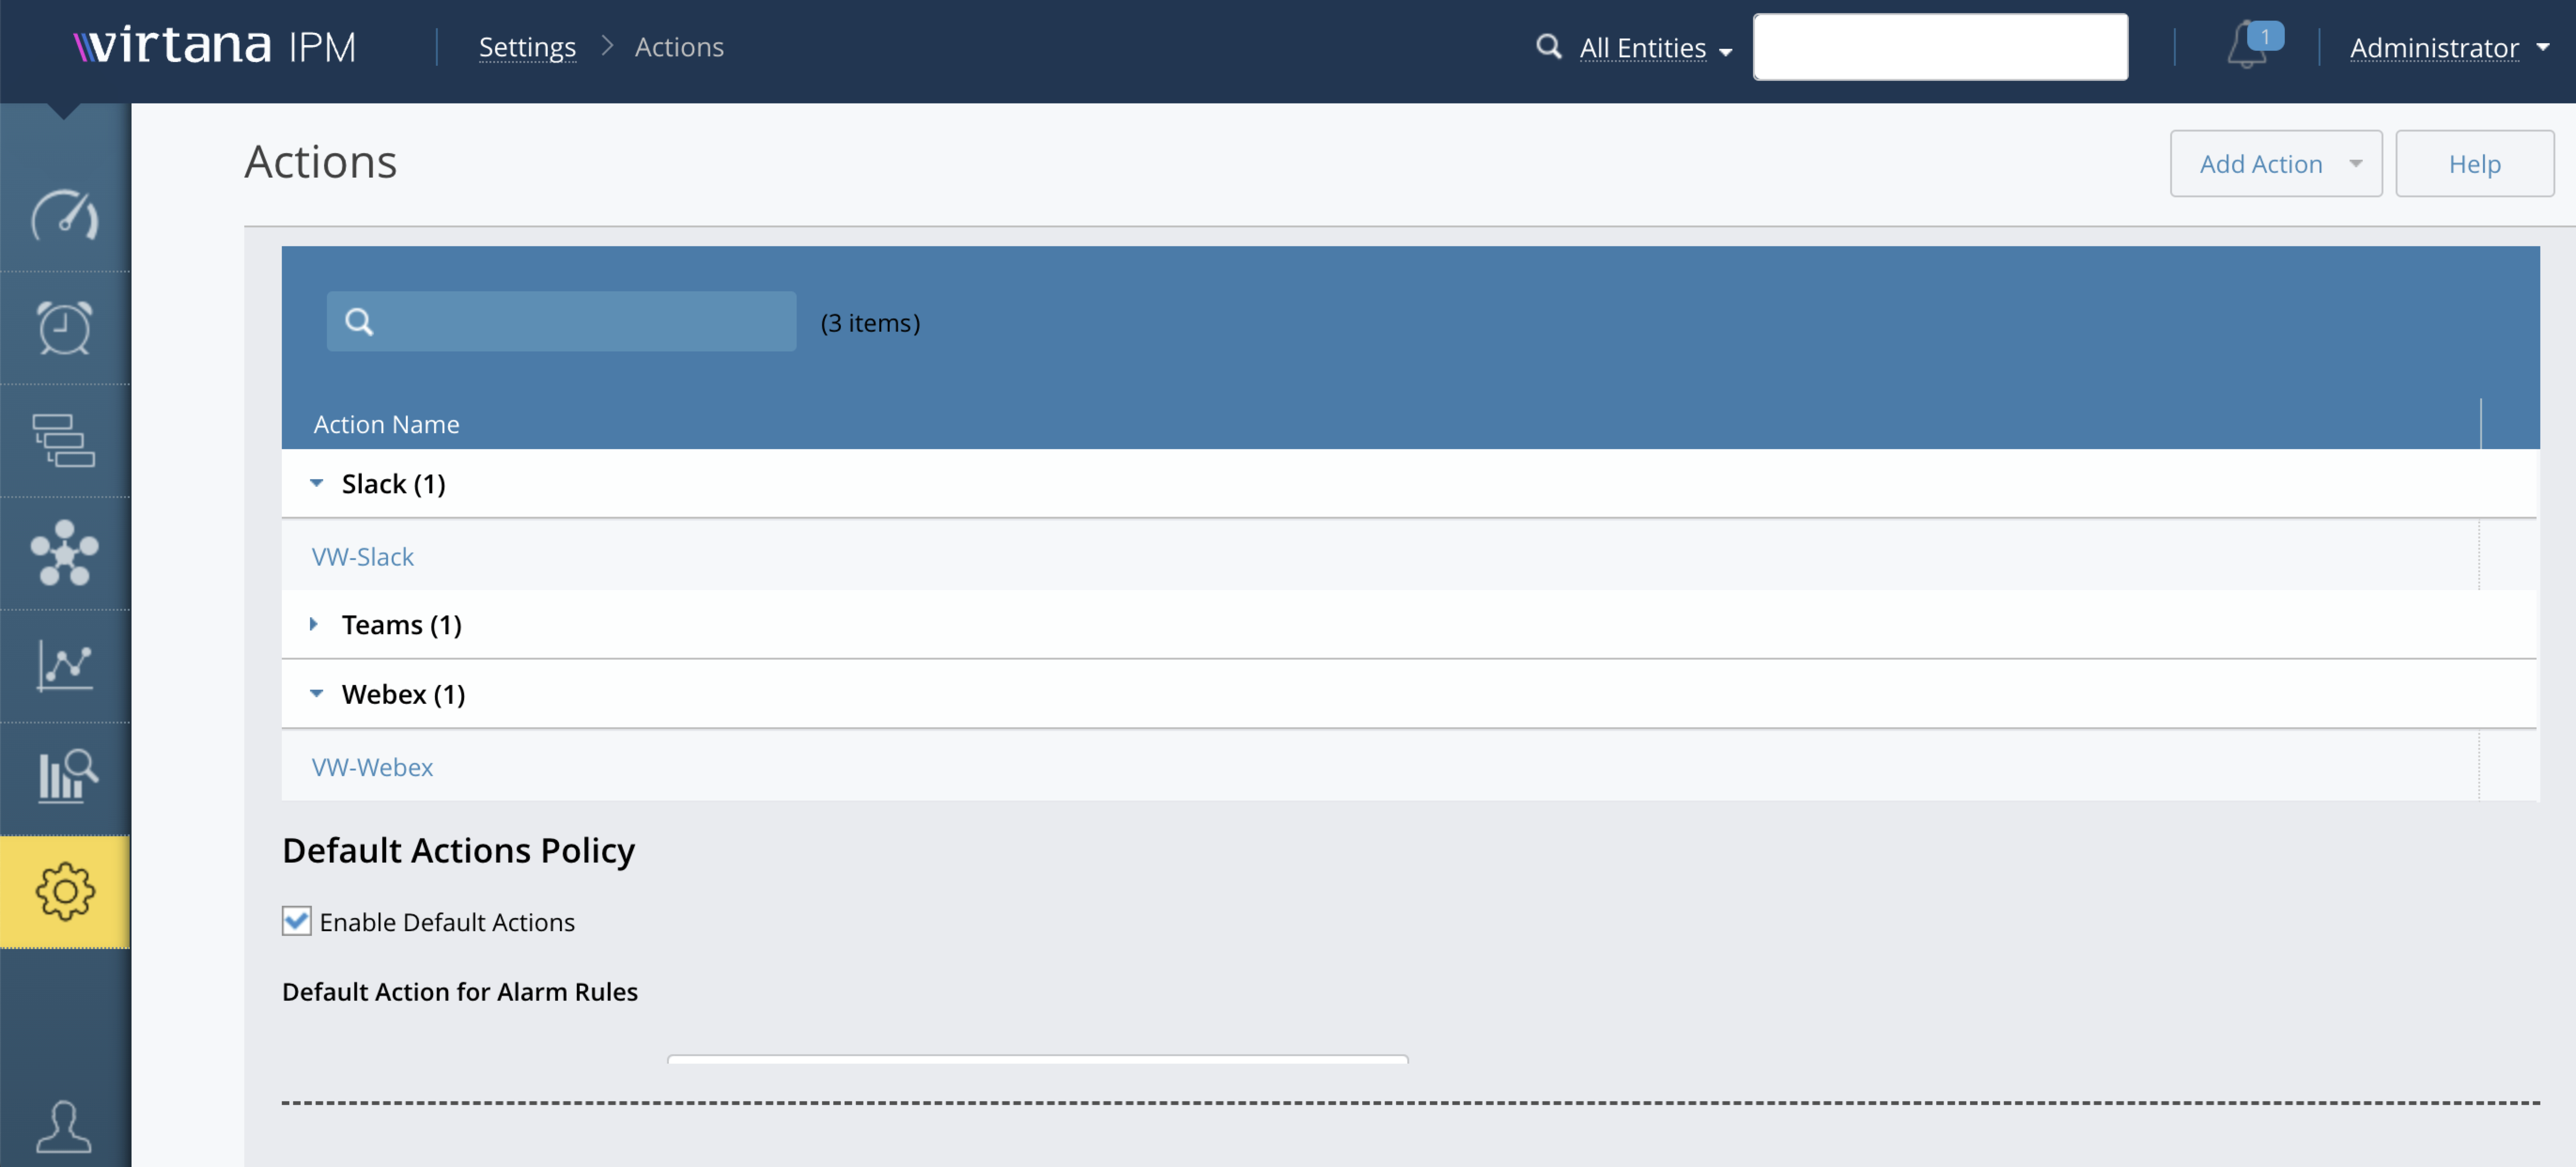
List Action Configurations
Navigate to Configurations List:
Click on Settings > Actions menu item
A list of all available action configurations is displayed.
Search Action Configuration by Name
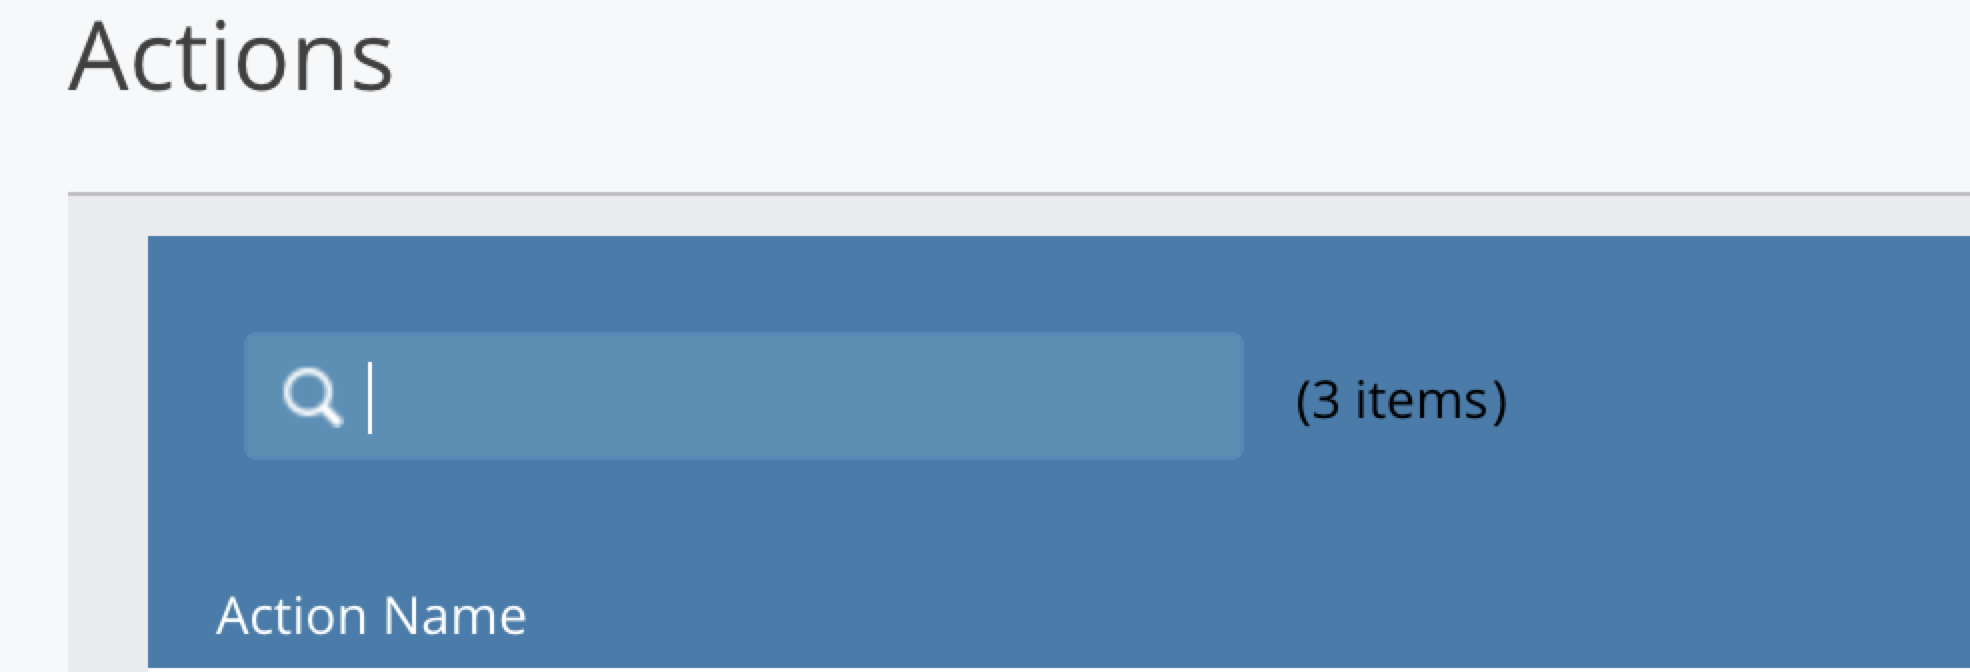
Click on Settings > Actions menu.
Locate the search bar or search input field at the top of the configurations list page.
Enter the name (or part of the name) of the action configuration you want to search for.
Click the Search button.
The list of action configurations remains filtered based on the search query until the search input is cleared or a new search is performed.
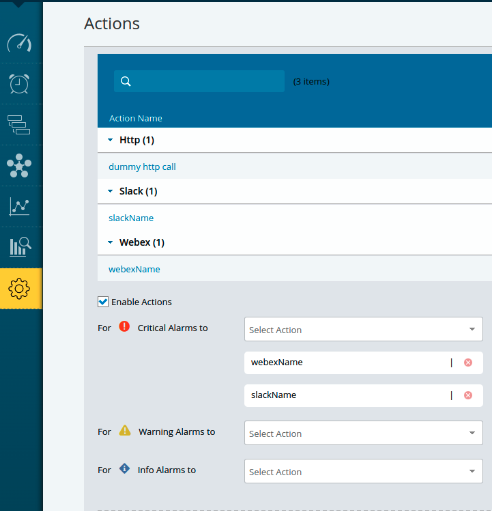
Default Action Policy
For each category of alarms (Info, Warning, and Critical), select the appropriate actions to be triggered. These actions can include notifications, alerts, or any predefined responses based on the severity of the alarm. Action configuration supports setting multiple actions, allowing you to configure various action types for both rules and actions settings.
Create an HTTP Configuration
Follow the steps to add HTTP action type.
Navigate to Settings > Administration >Action menu.
To create a new action, select Add Action from the drop-down menu and choose the HTTP type.
Provide the Name, HTTP endpoint URL, JSON data payload.
Add the HTTP header key value pair. (Refer to the sample)
Following is the sample JSON and the Header key values to enter.
Refer to the following sample json for more details:
{
  "title": "${title}",
  "titleLink": "${link}",
  "ruleId": "${ruleId}",
  "caseId": "${caseId}",
  "caseName": "${caseName}",
  "caseDescription": "${caseDescription}",
  "openTime": "${openTime}",
  "entityName": "${entityName}",
  "entityType": "${entityType}",
  "ruleName": "${ruleName}",
  "ruleType": "${ruleType}"<#if condition?has_content>,
  "ruleCondition": "${condition}"</#if>,
  "thresholdValues": [
    <#list thresholdValues as value>
    {
      "gaugeName": "${value.gaugeName}",
      "threshold": <#if (isPropertyTemplate?? && isPropertyTemplate) && (value.exceededValueString?? && value.exceededValueString?has_content)>
                     "${value.exceededValueString}"
                   <#else>
                     "Threshold: ${value.threshold}, Exceeded Value: ${value.exceededValue}"
                   </#if>
    }<#if value_has_next>,</#if>
    </#list>
  ],
  "sourceUuid": "${sourceUuid}",
  "severity": "${severity}"
}
JSON templates description
Virtana supports multiple categories of variables that can be used within templates. Each category corresponds to a different context of data available at runtime.
General Fields
${title} — Displays the title of the alert.Example: CPU usage exceeded threshold on server-01.
${link} — A direct hyperlink (URL) that opens the detailed view or monitoring dashboard for the specific alert or case.
${ruleId} — The unique identifier of the rule that triggered the alert.
${caseId} — The system-generated unique identifier for the created case or incident. Example: CASE-12345
${caseName} — The human-readable name assigned to the case or incident.
${caseDescription} — A brief or detailed description of the case or incident.
${openTime} — The date and time (in UTC) when the alert was opened or the corresponding action initiated.Format: yyyy-MM-dd HH:mm:ss (e.g., 2025-07-29 16:55:00 UTC)
Entity Information
${entityName} — The name of the affected entity such as a server, application, or database.Example: qe-appdisc-01.lab.vi.local
${entityType} — The entity type is the system-defined identifier for a monitored component, for example, ESXHost.
The internal name might differ from the display name in your environment. To retrieve the list of available entity types in your environment, use the following API call:
GET /api/sdk/p/2/schema/typeThis endpoint returns the full list of configured entity types within the system.
Note
The entity types available depend on the integrations configured in your system.
${sourceUuid} — The unique identifier assigned to the monitored source that reported the metric or event.
Rule Information
${ruleName} — The descriptive name of the monitoring rule that generated the alert.
${ruleType} — Defines the category of the rule. Supported rule types include:
Single Metric Rule: Monitors a single metric against a static threshold or defined range and triggers an alert when that boundary is crossed.
Single Metric Dynamic Rule: Monitors a single metric using dynamic thresholds derived from historical data or behavioral baselines.
Property Rule: Evaluates one or more non-numeric entity attributes or configuration properties to determine if the condition is met.
If a different rule type is specified, it may represent another predefined template available in the monitoring UI.
${condition} — The condition expression that triggered a property rule, defining the logical criteria evaluated during rule processing.
Metric and Threshold Values
${value.gaugeName} — The name of the metric (or gauge) that was evaluated as part of the rule condition.
${value.threshold} — The threshold value defined within the rule. The alert is triggered when the metric value exceeds or violates this specified threshold.
${value.exceededValue} — The actual metric value that surpassed the defined threshold.
Severity
${severity} — The alert severity level as defined in the rule configuration. Possible values include:
info
warning
critical
Header key values to enter:
{ "Accept": "application/json"}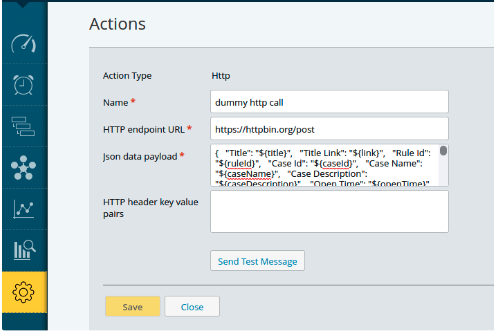
ServiceNow event notification via Actions
The ServiceNow event notification can be received via Actions in the Virtana environment. To integrate this, use the following sample JSON data playload:
{
    "records": [
        {
            "source": "Virtana",
            "event_class": "${sourceUuid}",
            "resource": "${entityName}",
            "node": "${sourceUuid}",
            "metric_name": "${caseName}",
            "type": "${entityType}",
            "severity": "1",
            "description": "${caseDescription}",
            "additional_info": "${link}"
        }
    ]
}
Enter the following in the Header key value pair section:
{
"Content-Type": "application/json",
"Authorization": "Basic <auth token>"
}
Replace the <auth token> with the actual basic auth token. A token can be generated with the command below.
Bash shell command for Linux or Mac users
echo $(echo -n '<username>:<password>' | base64)
Where <username> and <password> are the servicenow credentials.
Powershell command for Windows users -
[Convert]::ToBase64String([Text.Encoding]::UTF8.GetBytes("<username>:<password>"))
Using browser and a third party site example: Generate http Basic Auth Header.
The details of how basic access authentication token is generated can be found on this Wikipedia page: Basic access authentication .
Slack App Webhook Url
You can integrate Slack with Virtana’s platform using Slack's Incoming Webhooks feature. This enables external services to send automated messages directly into specified Slack channels. Follow the steps below to generate and use a Slack Webhook URL.
Note
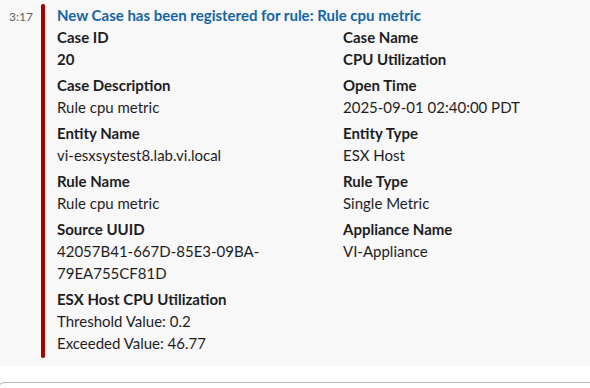
All the details you see in the screenshot (Case ID, Rule Type, Description, Severity, etc.) will appear the same in Slack, Teams, and Webex notifications.
Visit Slack API https://api.slack.com/apps.
Click Create an App.
Select From scratch.
Enter an App Name and select the Slack Workspace for installation.
Click Create App.
In the app configuration page, go to the left-hand navigation pane.
Click Incoming Webhooks.
Toggle the option to Activate Incoming Webhooks.
Scroll down to Webhook URLs for Your Workspace, click Add New Webhook to Workspace.
Select the Slack Channel where you want messages to be posted.
Click Allow to grant permission.
Copy the generated Webhook URL displayed under Webhook URLs for Your Workspace.
After authorizing, you'll be redirected back to the app's settings.
Copy the webhook URL will be displayed under "Webhook URLs for Your Workspace.
Use the webhook url in the add action in the UI.
Microsoft Teams App Webhook Url
Go to the Microsoft Teams app or the web version.
Choose the Your Teams where you want to send messages using the webhook.
Click on the "More options" (three dots) next to the channel name.
Click on Apps menu.
Click on Incoming Webhook and Add another team button.
Select channel name and set up a "Connectors".
To set up an Incoming Webhook, provide a name and select Create.
Click on create button.
After creation, the Webhook URL will be displayed. Copy this URL as you'll need it to send messages to the Teams channel.
Use the webhook url in the add action in the UI.
Webex Chat App Webhook Url
Open your browser and go to Webex Developer Portal.
Sign in to Your Webex Account.
From the list of available options, choose Webhook as the app type.
Selecting Webhook allows you to configure the app to receive data from Webex when specific events occur.
Configure the Webhook:
Name: Give your webhook a name (e.g., Incoming Webhook for Space).
Target URL: Enter the endpoint where Webex should send JSON notifications.
Resource: Select what to monitor (e.g., messages).
Event: Choose the event type (e.g., created for new messages).
Filter: Add roomId to specify the Webex space.
Secret (optional): Set a secret key to verify incoming webhook data.
Click Create to finalize and create your webhook.