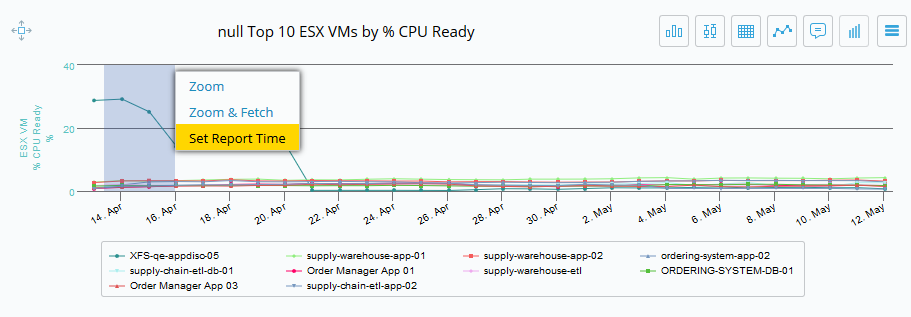
Zoom and Fetch and Set Report Time
You can zoom in on a chart area to provide a larger view of the data in that time frame.
Zoom
Select a time frame on a chart by positioning your mouse to a starting point on the chart then click and hold the mouse button and drag it to the end point for the desired range, then release the button. This brings up a menu with three choices: Zoom, Zoom & Fetch, and Set Report Time. Clicking on Zoom displays the selected time frame across the full width of the chart without changing the data summary points.
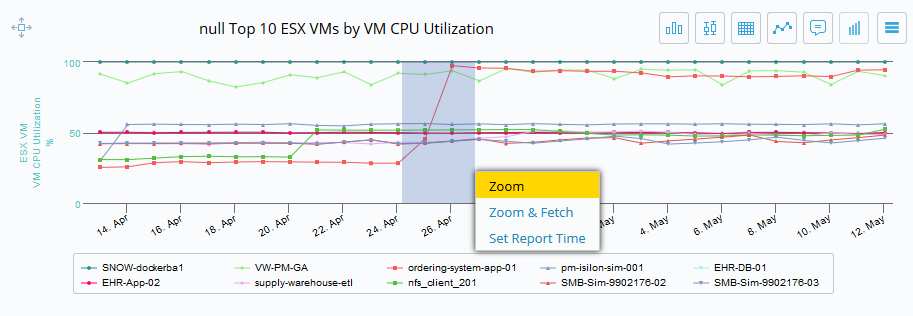
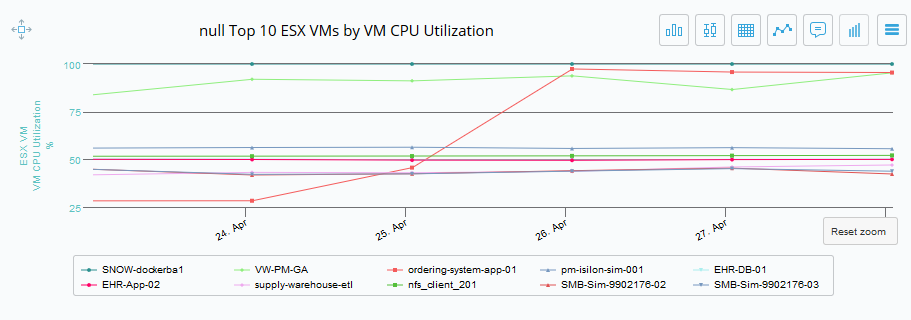
The chart is redrawn showing the data from the selected time frame.
Zoom & Fetch
You can also zoom in on a chart area and load more data points for the selected period, if data is available.
Select the time frame then click on Zoom & Fetch to perform the zoom and load more data.
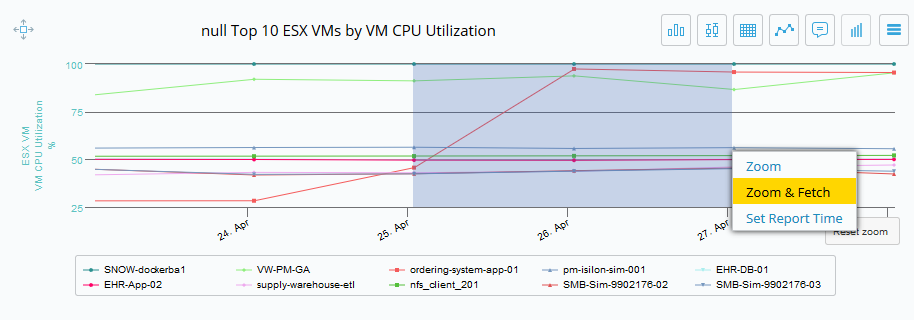
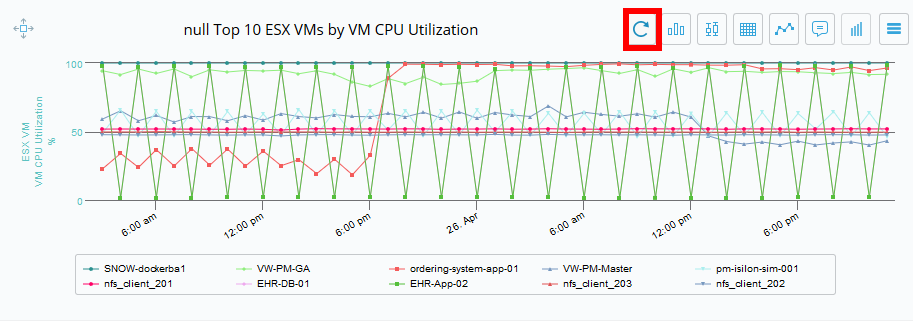
Zoom & Fetch displays the selected time frame across the full width of the chart and displays more data summary points, e.g., 10 min to 5 min. Click the Refresh button to return to the original view.
Set Report Time
You can also set the time for the entire report by making a selection using your mouse then selecting Set Report Time. This changes the date range for the entire report.