Metric Health
Metric Health graphically displays the quantity of data that comes from the collectors sending telemetry from the application cluster. The details of the data can be viewed at any time interval.
From Metric Health, you can analyze the following:
Graphical representation of the collector components' health and functioning in terms of the amount of data being scraped from the south side.
Type and amount of metrics being scraped from collector components along with time duration.
You can view the following list of details in Metric Health:
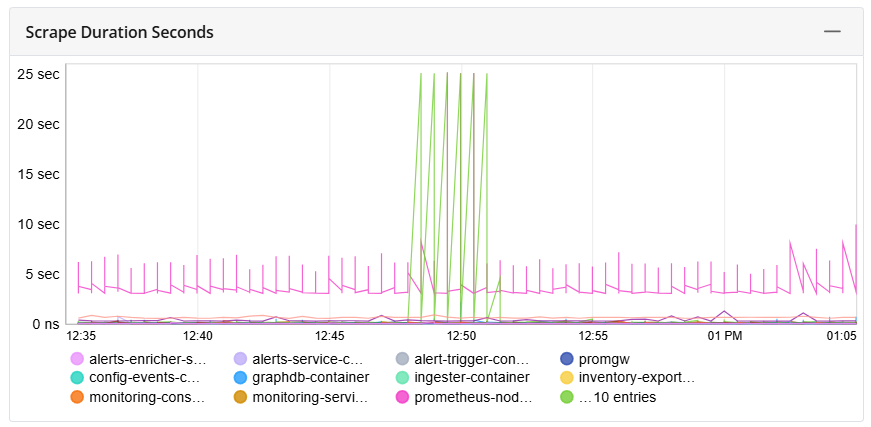
Scrape Duration Seconds: Displays graphically how often the data is scraped by the components from the different sources for each time interval.
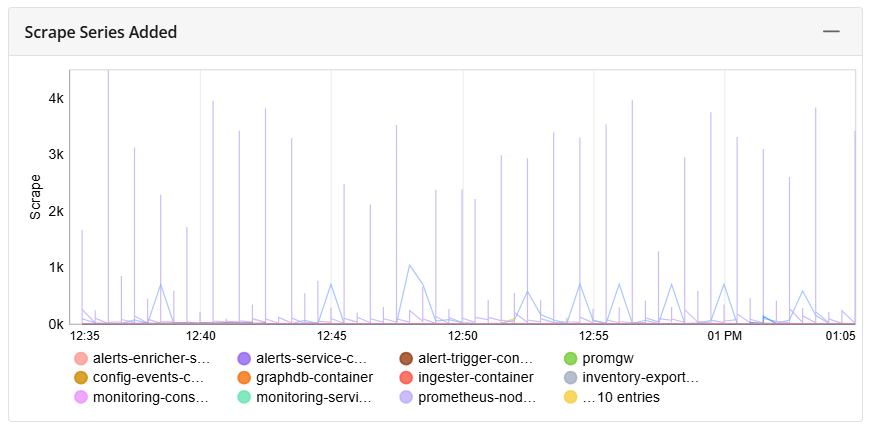
2. Scrape Series Added: Displays graphically the number of new additional metrics of the entity scraped by the collector components.
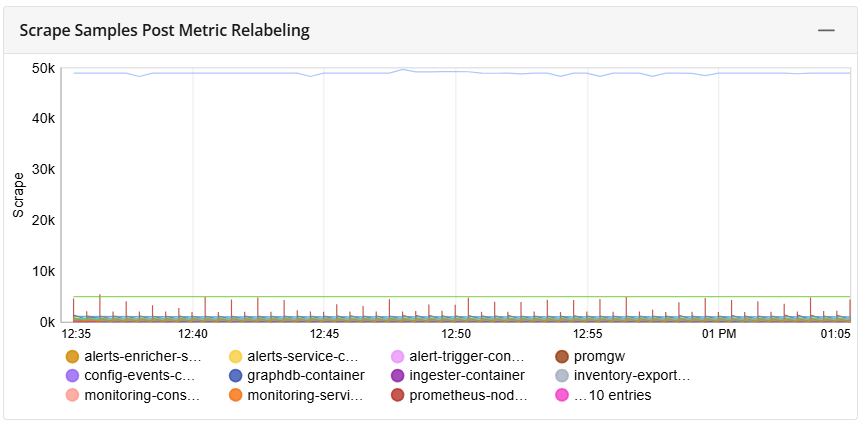
3. Scrape Samples Post Metric Relabeling: Displays graphically to visualize the number of new metrics scraped from the collector components after relabeling.
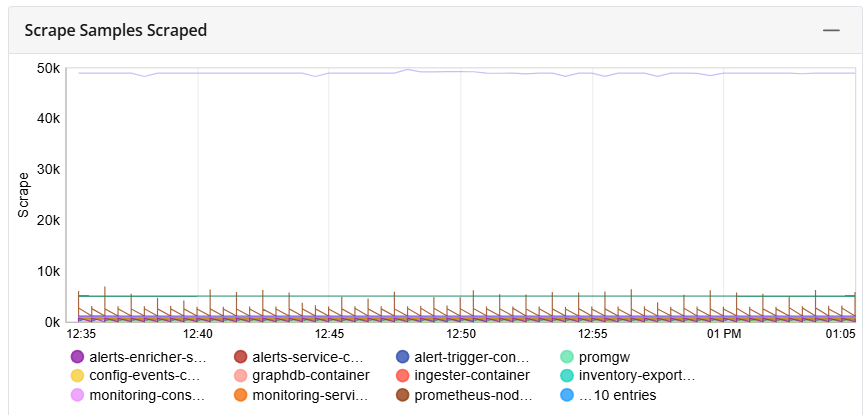
4. Scrape Samples Scraped: Displays graphically to visualize the number of new metrics scraped from the collector components after scraping.