DYNAMIC SERVICES
The SERVICES > DYNAMIC SERVICES page provides the most-frequently-used features of Service Impact.
Members view
The Members view provides details about a service member, including the list of its associated members.
The following example shows the Members view of a service member, with key features highlighted, and the view menu selected.
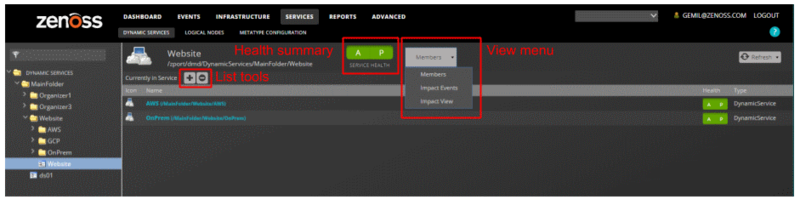
List tools
The list tools add or remove members from a service model.
Tool | Function |
| Display the Add to Service dialog box. |
| Remove a selected member from the service model. |


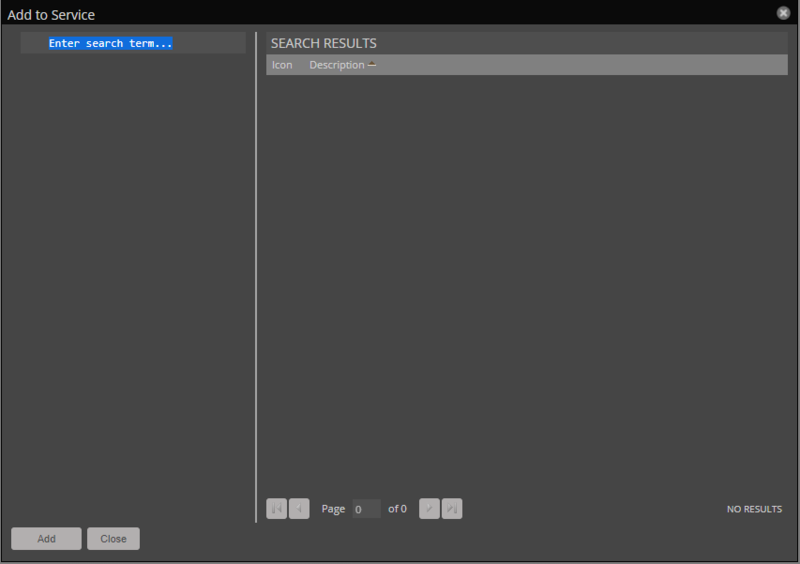
Add to Service dialog
Use the Add to Service dialog box to find and add members to a service model.
In the search field, enter the string to find. You can search for a specific device or component name, or component type (such as interfaces and OS processes) or group type (such as location and system). As you type characters, Service Impact displays matches.
Impact Events
The Impact Events view shows summary and detail information about events that are affecting a service.
The following example shows an Impact Events view with key features highlighted. The last event in the details area is expanded to show the Impact chain, which is the hierarchy of service model members that are associated with the event.
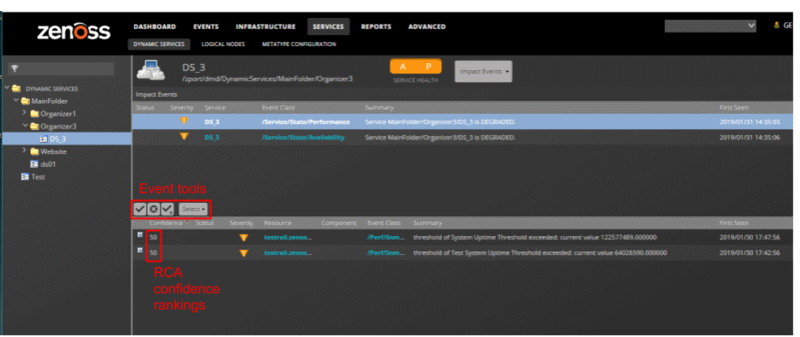
Event tools
The event tools provide options for manipulating the list of events.
Tool | Function |
| Acknowledge the selected event. |
| Close the selected event. The event is moved to the archive. |
| Undo acknowledgement of the selected event. |
| Display the event selection menu. Select All Select all events in the list. None Deselect all selected events. |


Root-cause analysis (RCA) confidence rankings
The second column of the details list contains the event's confidence ranking. Service Impact knows which members affect which service models, and automatically performs RCA when an event occurs. The analysis yields a probability value that an event is the cause of the service's current state. Often, multiple events contribute to a state, so the confidence rankings enable you to quickly focus resources on the most likely cause.
Impact View
The Impact View displays the interactive Service Impact graph of a service model and provides several views and tools.
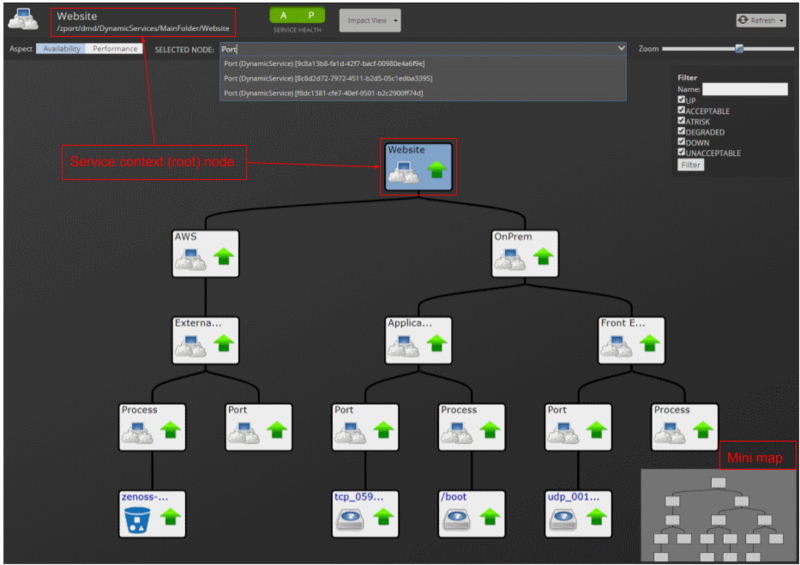
Service context (root) node name
In the upper left above the Aspect controls, the service context (root) node of the graph is displayed, along with its tree view path. Click the name to make the root node the selected node and display its name in the Selected node field.
Aspect views: Availability, Performance
Use aspect views to display and filter on availability or performance states in the graph.
Selected Node
Displays the name and type of the node that you have chosen, or the service context (root) node if you have not chosen a node. For example, DB Hosts (Organizing Group) is the node named DB Hosts, which is an organizing group type. When you first access the Impact View, the Selected Node field displays the root node. To resize the Selected Node field, hover the pointer to the left of the field label to display the resize tool, and then drag the tool left or right. When you choose a node from the list or click a tile in the graph, that node appears in Selected Node and the node tile is centered in the graph.
To search for specific nodes, begin typing a string in the Selected Node field. The field's drop-down list displays matching nodes in the following format:
node_name (node_type) [UID]
Tips for searching nodes:
Strings are not case sensitive.
Regular expressions are not supported.
You can search for nodes by name, type, or system-generated unique identifier (UID).
To search for nodes by name only, suffix the search string with an open parenthesis. For example, the following string matches only node names that end with "Hosts," such as the DB Hosts node.
Hosts (However, the following string matches nodes with "hosts" in the name or type.hostsTo search for nodes by type only, prefix the search string with an open parenthesis. For example, the following string matches only node types beginning with "vSphere," such as the vSpherePnic type.
(vSphereHowever, the following string matches nodes with "vsphere" in the name or type.vSphereTo search for nodes that contain the same character string in the UID, prefix the search string with an open bracket. For example, the following string matches only nodes with a UID beginning with "G7M," such as G7M589.
[G7MHowever, the following string matches nodes with "G7M" in the name, type, or UID.G7M
Zoom
To increase or decrease the size of tiles in the graph, use the mouse wheel or drag the Zoom control in the upper right corner of the view.
Node tools
To see a summary of a node in a Service Impact graph, hover the pointer over its tile. Summary information includes the node name, availability state, performance status, production status, and type.
To display the following menu options for a node, position the pointer over it and right-click:
Toggle Children : Hide or display the node's child and descendent nodes.
Edit Impact Policies : Display the Impact Policies dialog box. See Impact Policies dialog. Note, Impact Policies for Availability and Performance are set separately, depending on which aspect is selected.
Center view on node : Adjust the view so the selected node is in the center of the display area.
Node tile
The node tile graphically represents a server or service node and information about it, as described in the following table:
Node tile example | Description |
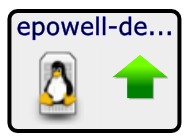
| This tile represents a Linux server named epowell-debug.zenoss.loc. (The name is shortened to fit inside the tile.) The computer icon and penguin image represent the node's type, Linux server. The green arrow and the black border represent the node's availability state, UP. |
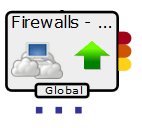
| This tile represents a service node with a global policy. Event rainbows are displayed. The event rainbow is the colored tabs on the right side of the tile. From top to bottom, the rainbow shows the counts of critical, error, and warning events that are associated with the node. The first example node has no events, so no numbers are displayed. The second example node has 1 critical error. When you click an event rainbow tab, Collection Zone displays the overview page of the node. This tile includes three dots immediately below its bottom border. The dots represent descendant nodes. To display the descendant nodes, double-click the node tile. |
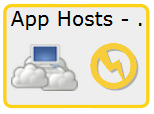
| This tile represents a service node. The yellow icon and border represent the node's availability state, ATRISK. |
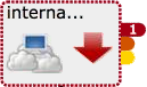
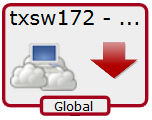
| This tile represents a service node with a global policy. The red arrow and the red border of the tile represent the node's availability state, DOWN. |
Impact Policies dialog
In the Impact Policies dialog box, add or edit state triggers for contextual or global policies. Note, Impact Policies for Availability and Performance are set separately, depending on which aspect is selected.
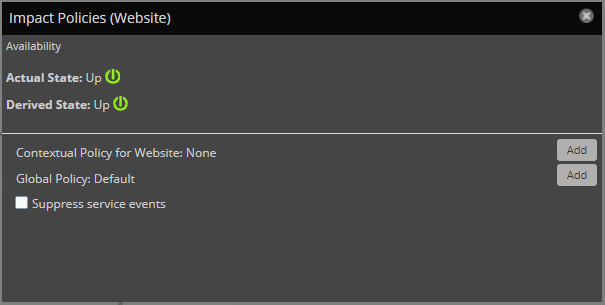
To prevent sending service events when changes affect a node, check Suppress service events (not shown). Choose this option when a service node is used solely to group child nodes.
If a custom state provider is not associated with a node, the dialog box does not contain the option to edit the custom state provider.
For a policy or custom state provider, click Add or Edit to access options.
Edit Policy options (Availability)
Use the Edit Policy options to add or edit state triggers for contextual or global policies.
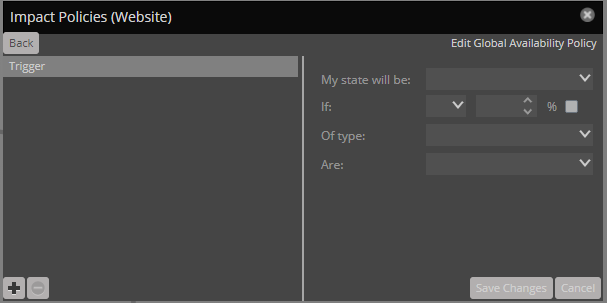
To add a trigger, in the lower-left corner click Add. On the right side of the dialog box, modify the trigger fields (described in the following table), and then click Save Changes.
Field | Description |
|---|---|
My state will be | The new state, if the trigger applies. Possible states: DOWN, DEGRADED, ATRISK, UP. |
If | The conditions that trigger a state change. To specify a percentage rather than an absolute value, click %. |
Of type | Restrict the type of child node to which the trigger applies. Types other than Any are exclusive. |
Are | The state of child nodes that cause an evaluation of this trigger. Possible states: DOWN, DEGRADED, ATRISK, UP. |
Edit Policy options (Performance)
Use the Edit Policy options to add or edit state triggers for contextual or global policies.
To add a trigger, in the lower-left corner click Add. On the right side of the dialog box, modify the trigger fields (described in the following table), and then click Save Changes.
Field | Description |
|---|---|
My state will be | The new state, if the trigger applies. Possible states: UNACCEPTABLE, DEGRADED, ACCEPTABLE. |
If | The conditions that trigger a state change. To specify a percentage rather than an absolute value, click %. |
Of type | Restrict the type of child node to which the trigger applies. Types other than Any are exclusive. |
Are | The state of child nodes that cause an evaluation of this trigger. Possible states: UNACCEPTABLE, DEGRADED, ACCEPTABLE. |
Edit Custom State Provider options
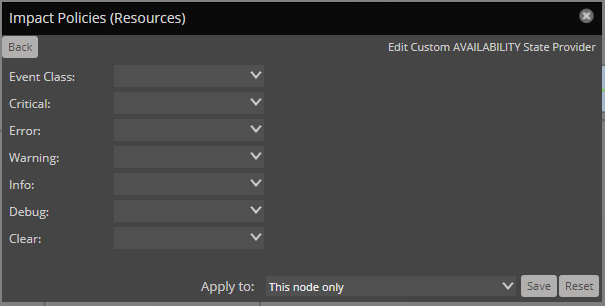
Use a custom state provider to add state triggers (rules) for custom device and component service model members. You can customize Collection Zone to gather state data from events that belong to other classes. For example, you can customize state providers to define state triggers for members that are monitored through customized classes that the ZenVMware and CiscoUCS ZenPacks provide.
Field | Description |
Event Class | Choose the Collection Zone event class to monitor. You can configure one event class per device. |
Event severity fields (Critical, Error, Warning, Info, Debug, Clear) | Choose the state for this member if the event severity is observed. Possible states are UP, ATRISK, DEGRADED, DOWN. |
Apply to | Choose the nodes (components) to which the state override applies. This node only: The selected component on the specific device. Nodes of the same type on the same device: The same component type on the same device. If a component is associated with another device, it is not affected in that context. Nodes of the same type in the same device class: The same component type on any device with the same device class. Nodes of the same type system-wide: The same component type, regardless of the device or the device class. |