GPU Fleet Analysis
You can use the GPU Fleet Analysis dashboard to view a snapshot of the health of your GPU fleet.
This dashboard provides you with tools to discover deep, minute-by-minute insights into the GPU usage across your organization, including on-premises, in the cloud, or hybrid. Use the dashboard to help you identify cost-saving opportunities, optimize performance, and ensure infrastructure reliability.
GPU fleet views
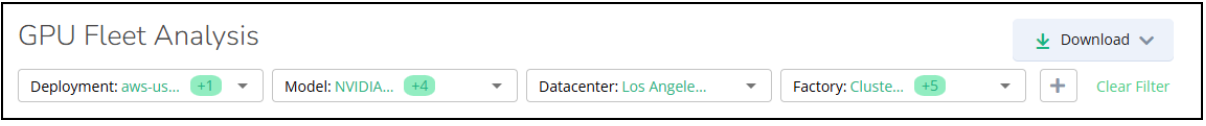
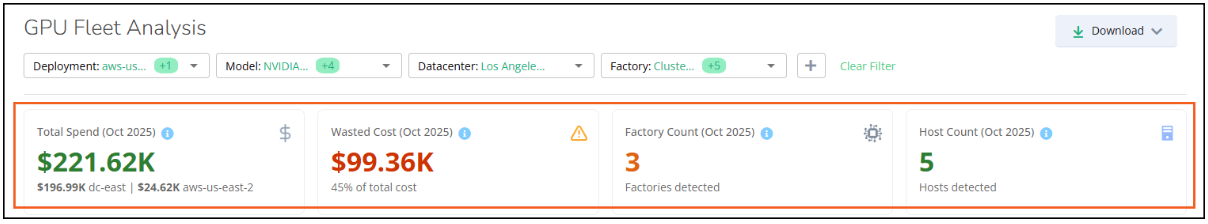
A GPU fleet is a group of graphical processing units (GPUs) that you want to monitor. You can create a view for the GPU fleet by choosing filters in the top of the dashboard. Select the deployments you want to view and optionally set filters to narrow the scope to GPU model, data centre location, cluster, and more.
Prerequisites
To get started using the GPU fleet analysis dashboard, ensure that you have the following requirements:
Virtana monitoring agents or API integrations must be deployed on all GPU-capable nodes for cloud and on-premises.
An active Virtana account with dashboard access permissions. See Setting up access between IO and Global View.
Network connectivity to Virtana Platform from all GPU environments.
Cost meter cards configured to track GPU usage and associated costs across environments.
(Optional) Integration with NVIDIA DCGM (NVIDIA Data Center GPU Manager) Exporter for enhanced Kubernetes support.
Configure cost meter cards
Create a cost meter card to capture GPU-related cost metrics that you can view in the GPU fleet analysis dashboard. Cost meter cards help define pricing categories, such as compute, GPU, and storage, as well as corresponding units, so you can track costs and view reports of GPU usage.
To get started, see Creating Cost Meter Cards.
Open the dashboard
Be sure that your Virtana account has permissions for the GPU Fleet Analysis dashboard. After opening the dashboard, set the filters for your GPU fleet view.
Log in to the Virtana Global View and click Dashboards.
Select GPU Fleet Analysis. The dashboard opens.
Create your view by choosing filters.
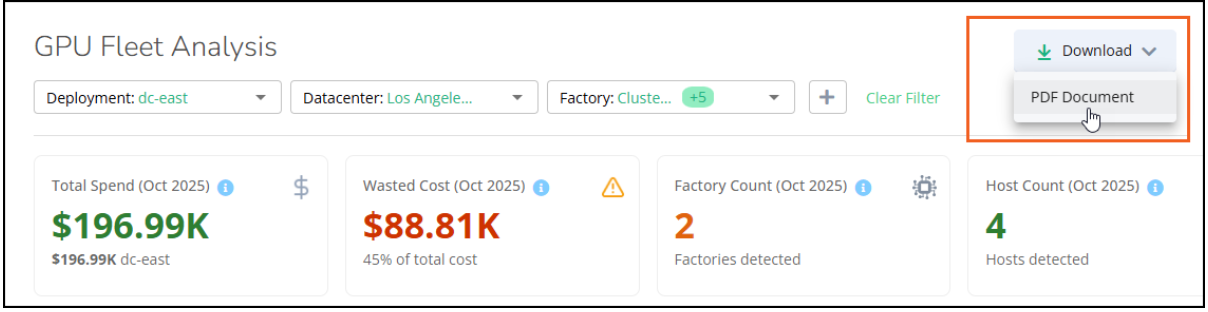
Download the dashboard
You can download the main dashboard page as a PDF document. This is useful when you want to create a filtered view of the dashboard to share as a report with your teams.
To save your dashboard locally, click Download > PDF document.
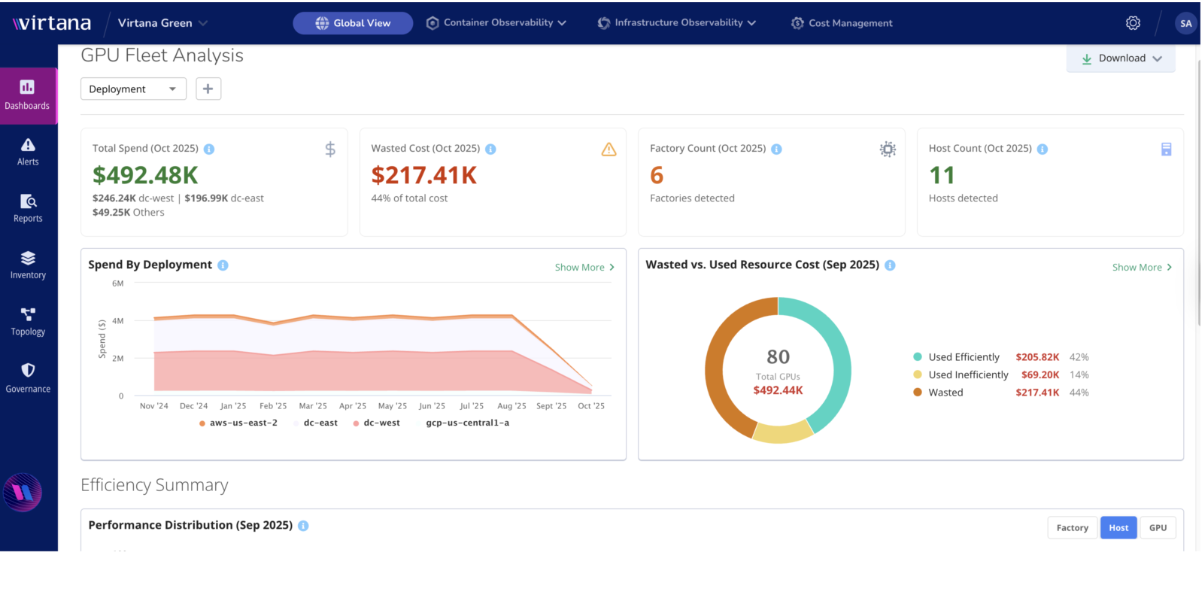
Viewing the GPU Fleet Analysis dashboard
When you open the dashboard, you can view a quick snapshot of the health of your selected GPU fleet view.
This snapshot captures the highlights of the dashboard, including total spend and wasted cost. This gives you a good starting point for further investigation.
Let’s take a closer look at each of these key panels:
Total Spend
Here you can view the total cost for the current month in dollar amounts. Individual deployments are listed below this total to give you a quick idea of how that total is divided among your selected deployments. With this information, you can identify your high-cost deployments for further investigation.
Wasted Cost
Identifies the total dollar amount that was wasted for the current month and identifies the percentage of waste in your total cost. In many cases, this wasted cost is due to idle GPUs or throttling. This panel provides another starting point for your investigation so you can identify the GPUs that are idle or underused and address these issues.
Factory and Host Counts
Provides the total number of factories and hosts that are a part of this snapshot so you can quickly see how your resources are scaling and changing in your environment.
Tracking cost trends
Below the snapshot view, you can drill into a couple of cost trend charts.
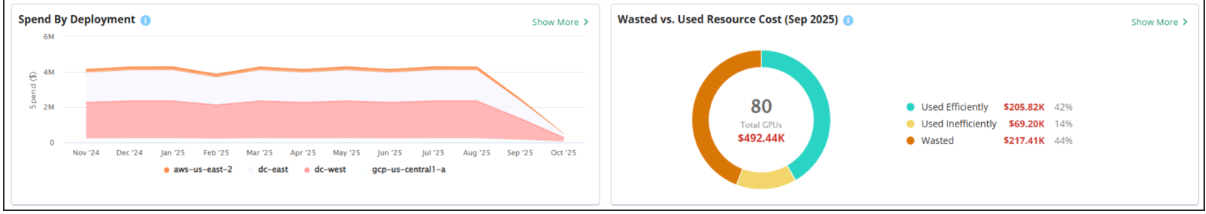
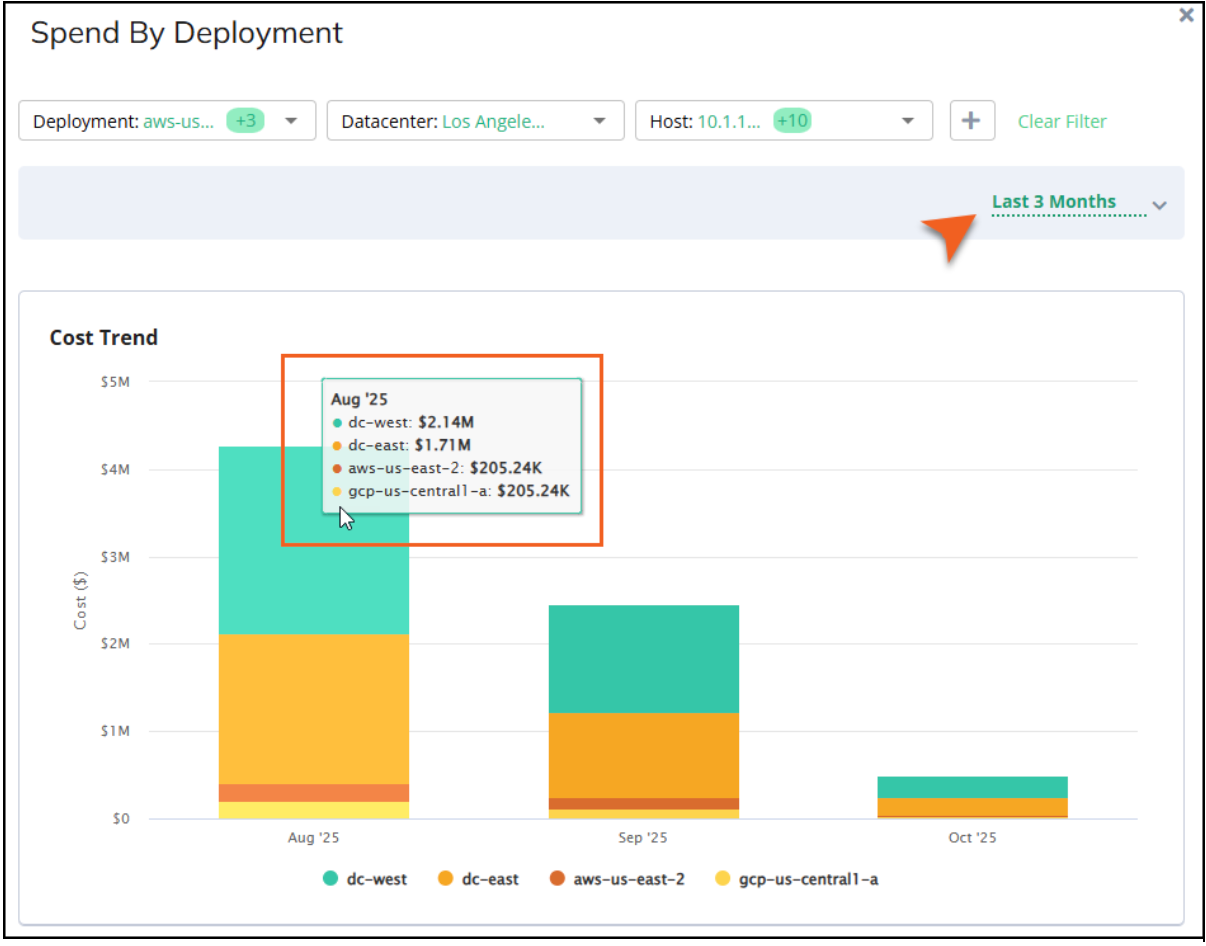
Spend by Deployment
This line chart shows the total spend by month, grouped by deployment, over the past 12 months. For a quick view of a particular month, hover your mouse over the chart for that month to see the costs of each deployment for that month. This is useful when you see a spike on the chart and you want to see which deployment may be involved.
To drill down, click Show More to open the Spend by Deployment panel where you can view total costs in a stacked bar chart to help you better understand your cost spikes.
Use the quick filter in the table below the chart to search your entities to help you identify specific areas where you can make improvements.
GPU Cost and Utilization
The donut chart in this section breaks down the percentage of wasted resources, inefficiently used resources, and efficiently used resources for the current month. To drill into this data, click Show More to open the cost trend chart to view how much cost is consumed by wasted or inefficient resources.
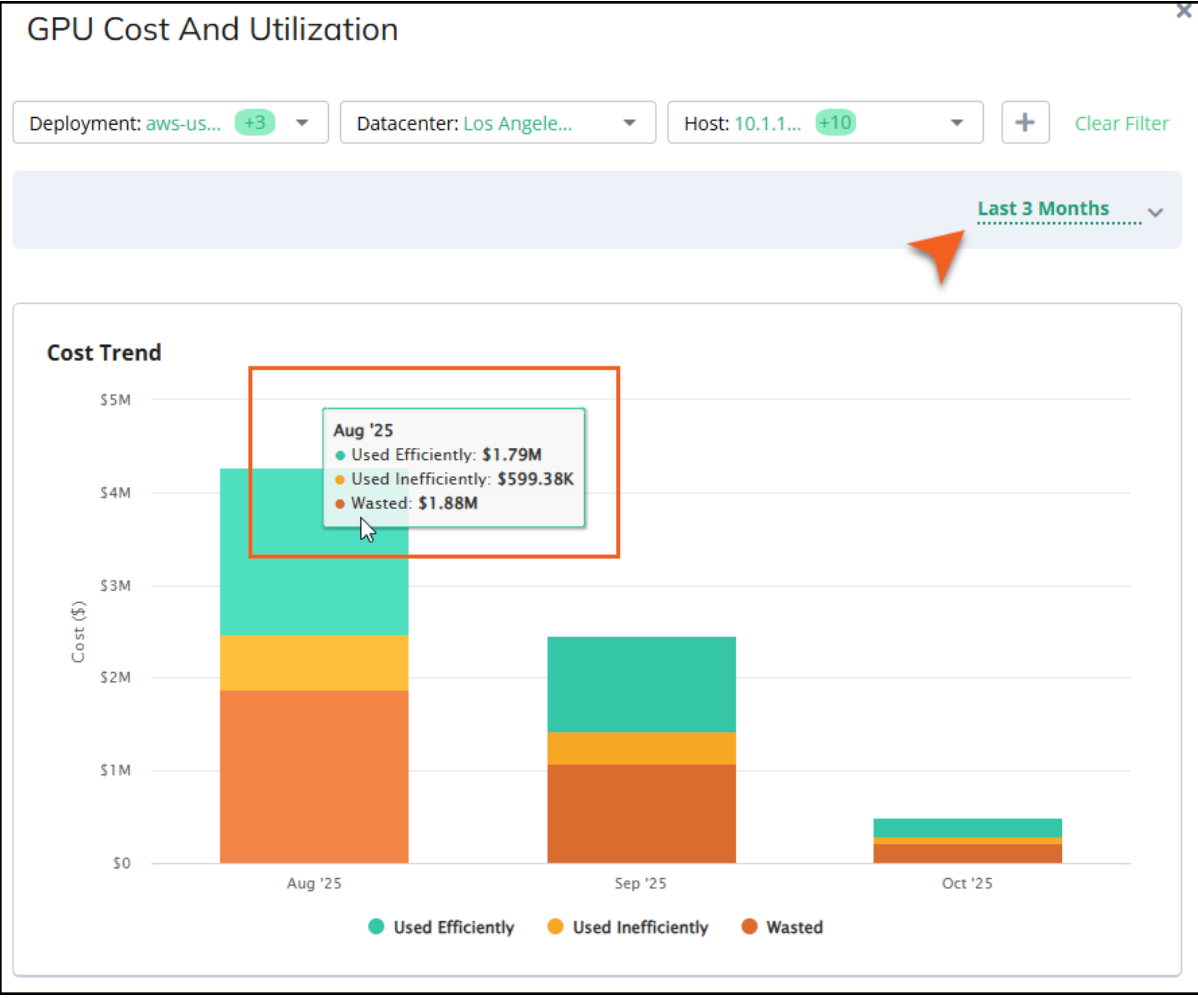
In these charts, wasted resources are those that are idle or throttled. Inefficient resources are those that are used, but not optimally, which can cost you money. In addition to helping you identify wasted and underused resources, the cost trend chart can also help see if you are improving in your efficiency month to month or quarter to quarter.
Use the quick filter in the table below to search your entities to help you identify specific areas where you can make improvements.
Using efficiency metrics to identify savings
To identify cost savings, you need to easily identify not just wasted resources, but those that are underused or inefficient. You could be using all your GPUs, but perhaps not at full capacity and therefore not optimally. The Efficiency Summary chart helps you identify these types of cost-saving opportunities.
The Efficiency Summary provides a comprehensive visualization of potential savings, GPU utilization, and efficiency. This data is organized by factory, host, or entity (GPU), and is based on the current month's spending and performance. The size of the bubbles on the chart indicates the wasted cost: the larger the bubble, the larger the amount of wasted cost. This chart shows where you have the greatest opportunity to save cost or optimize efficiency by combining inefficient and wasted cost data into a single “bubble.” For example, you might consider adding more workload before buying new hardware.
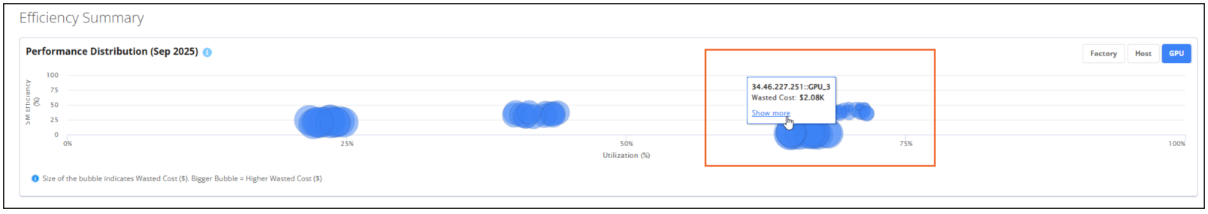
To drill down, hover your mouse over the bubbles on the chart to view details. You can also click Show More in the pop up to open the GPU Cost and Utilization panel filtered for the selected factory, host, or entity.
Identifying wasted resources and causes
Understanding GPU inefficiency and data center power consumption is crucial for optimizing performance and cost. GPU waste can stem from several factors, including idle GPUs that are powered on, but not actively used; software limitations, like application or configuration constraints that throttle performance; and hardware restrictions, such as overheating or insufficient power supply. Identifying these root causes allows for faster and more effective solutions.
Additionally, monitoring data center power consumption involves tracking the total kilowatt-hours (kWh) used by GPU resources. This information is vital for controlling energy costs and developing sustainable operational plans.
You can use the charts in the Wasted Resources section to help you identify these types of problems so you can begin to solve them.
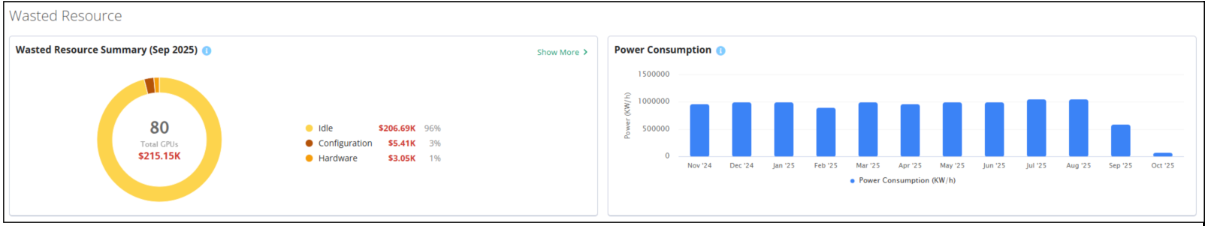
The Wasted Resource Summary provides you with a percentage of wasted spend for the current month organized by the cause of the waste, such as idle resources, configuration issues, or hardware/power reasons.
Idle: GPU is powered but not running any tasks. This is often the biggest contributor to waste.
Configuration: Software-based limitations where application or configuration constraints throttle GPU performance.
Hardware/Power: Issues like overheating or low power supply prevent full GPU utilization.
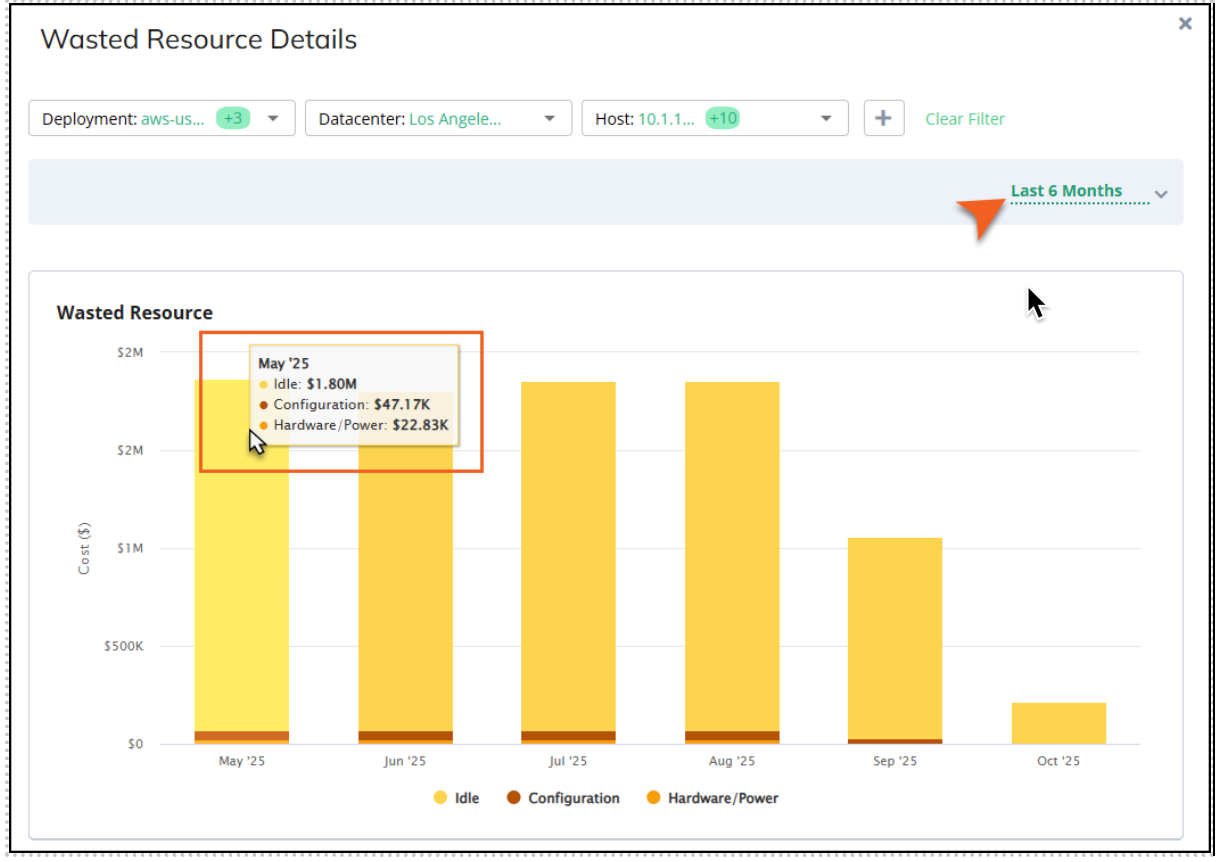
Use this chart to help identify the root causes of GPU waste for faster, more effective remediation. To drill into this data, click Show More to open the Wasted Resource Details panel. Here, you can view the cost trend chart which highlights how much cost is consumed by wasted resources for idle, configuration, or hardware/power issues.
Use the quick filter in the table below this chart to search your entities to help you identify specific areas where you can make improvements.
The Power Consumption bar chart shows your power consumption in kilowatt hours by month over the last 12 months. You can use this chart to monitor energy usage for cost control and sustainability planning.
Best practices for using the GPU Fleet Analysis dashboard
You can use this dashboard to gain insight and take action on your GPU Fleet data. You might consider the following actions:
Prioritize optimizations: Focus on expensive/high-throughput GPUs before lower-impact assets.
Review waste before scaling: Always audit code/workload and configuration-driven waste before adding new hardware.
Tag resources for clear reporting: Use tags for cost allocation, project tracking, and easier troubleshooting.
Act on power trends: Investigate persistent or sudden increases in power draw as early warnings for efficiency losses.
Exploit minute-level data: Use fine-grained data to focus on short-lived performance drops or outages.