 Service Health tile
The Service Health tile displays the status of one or more dynamic services defined in Service Impact.
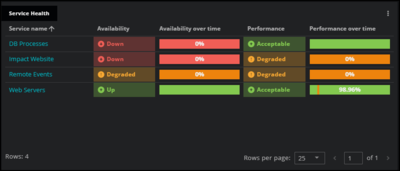
The text, coloring, and, optionally, shading represent the most recent availability and performance states.
A horizontal bar (optional) represents the history of Service Impact events during the current time range.
You can create a filter to select a subset of the dashboard’s scope, and you can choose to display the availability state, the performance state, or both states. Within the tile, you can temporarily change the sort order, select the number of rows displayed per page, and navigate between pages.
When the tile is large enough, the tile includes a horizontal bar representing the current time range, with vertical lines in the bar representing Service Impact events during the range. When you click on a service name, Virtana Service Observability opens the service’s home page in Service Impact.
Optionally, you can view availability and performance percentages on the tile. These percentages indicate the proportion of time that the service is considered available and performant. This information gives you a quick and easy way to assess the health of your services. You can customize the types of events that are included in these classifications in the Tile Configuration panel.
You can use the ZenPackLib.ImpactService entity type in the dashboard scope editor to select dynamic service entities, if desired.
Example tile
Configuring the tile
You can set the following options to determine how your tile appears in the dashboard.
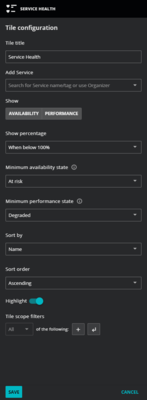
- Tile title
Enter a name for the tile. This text appears in the upper-left corner of the tile.
- Add Service
(Optional) Enter one or more specific services to include in the tile, a subset of the dashboard’s scope.
- Show
(Optional) Select the indicator type(s) to include in the tile. The default is to show both Availability and Performance indicators.
- Show percentage
(Optional) Select when to show a percentage for the indicator type. Options include:
When below 100%: Percentages only show when the indicator is below 100%. This is the default option.
Always: Percentages always show for the indicator.
Never: Percentages never show for the indicator.
- Minimum availability state
(Optional) Select the lowest state at which the service is considered available.
Up: The minimum state for services to be considered available is up.
At risk: The minimum state for services to be considered available is at risk or higher.
Degraded: The minimum state for services to be considered available is degraded.
- Minimum performance state
(Optional) Select the lowest state required for the performance percentage.
Acceptable: The minimum state for services to be considered performant is acceptable.
Degraded: The minimum state for services to be considered performant is degraded.
- Sort by
Select the column that determines the order of the items in the table.
- Sort order
Sort the selected column in either ascending or descending order.
- Highlight
A toggle that enables or disables colored shading in the Availability and Performance cells.
- Tile scope filters
(Optional) Create a specific filter just for the tile. This is useful if you need to compare different services side-by-side.
Use the query builder to create and apply a filter to the tile:
Click the + (plus sign) to add a clause.
To define the clauses, click in the first field to select an entity field.
Select your operator, then select your value.
To add or remove clauses, use the buttons in the query.