Balance Finder
Balance Finder examines traffic patterns and determines if they are balanced accurately across the hosts. In large organizations the goal is to make sure that the host workload and the associated traffic is appropriately balanced across the environment. Balance Finder validates that servers in the environment have functioning path failover, ensuring availability to and from storage in event of a failure. It also validates whether there is available capacity in the event of a path or component failure in the environment.
Balance Finder validates that the hosts supporting your applications have functioning path failover, ensuring availability to and from storage in the event of a failure.
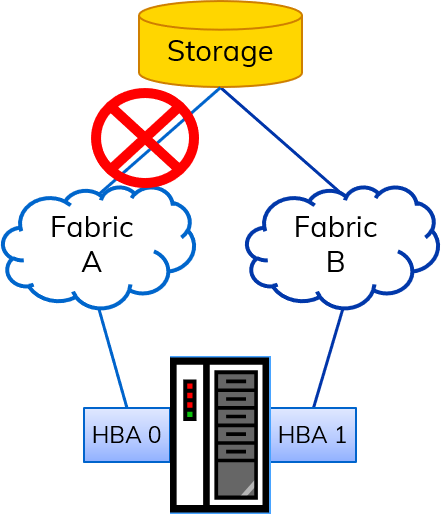
Balance Finder shows you where your multi-pathing configuration may pose a risk in the event of a failure in the path from your hosts to storage.
Running Balance Finder
The first step in using Balance Finder is to specify a host or a set of hosts to analyze. Please note that the analytic expects entities of type Host. While there are many different types of hosts that IO may discover, the generic Host entity is what is expected.
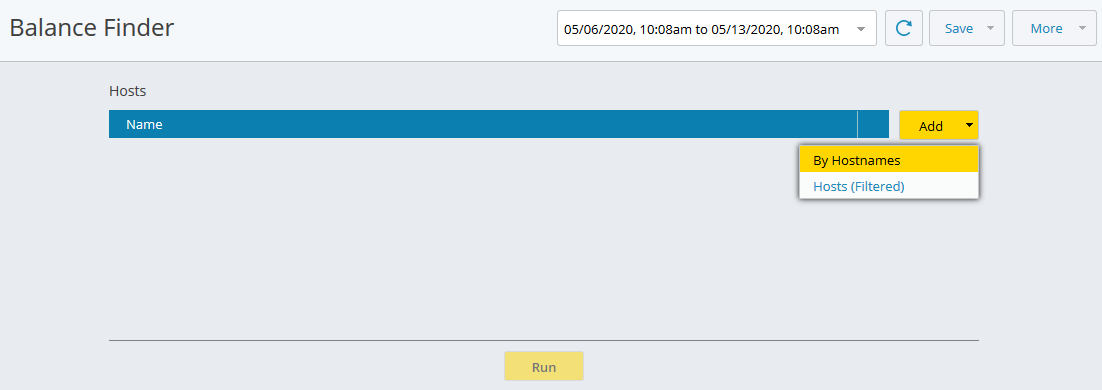
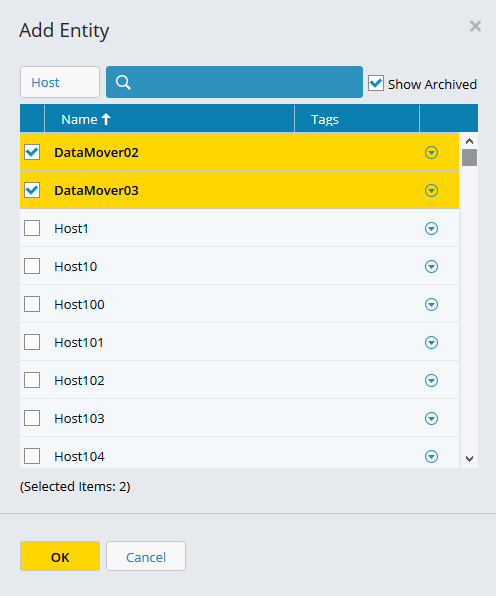
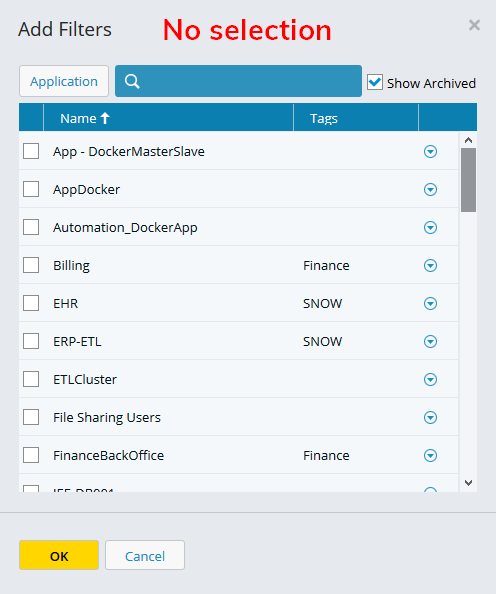
You can run Balance Finder against one or more named hosts. Select By Hostnames, then check the named hosts to run Balance Finder against.
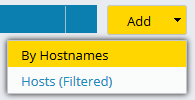
Alternately, you can run Balance Finder against hosts that are related to an entity. Select Hosts (Filtered), then select the entity type and choose the entities to use in the "related to" filter.
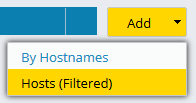
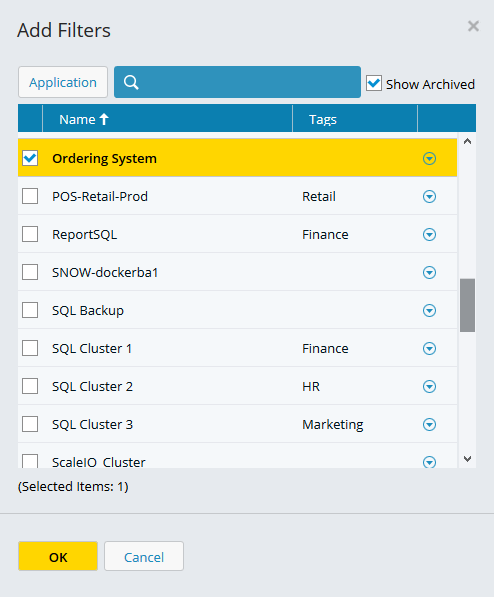
Finally, you can run Balance Finder against all hosts in your environment. Select Hosts (Filtered) then click OK from the Add Filters dialog to run Balance Finder against all hosts.
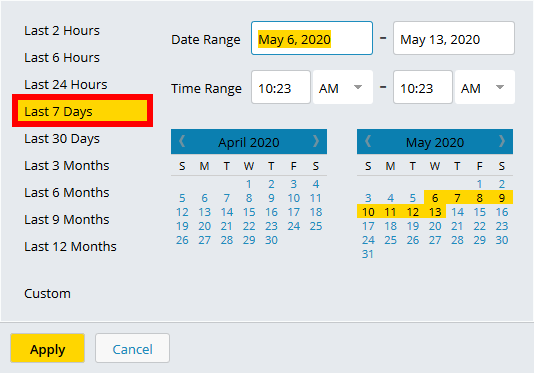
Select the date range.
Run Balance Finder for the last 7 days then weekly thereafter. You can choose to run the report in the background and receive a notification when it is completed. Note that the results will be automatically saved and will be available under the View All Outputs tab on the Analytics home page.
Understanding Balance Finder Results
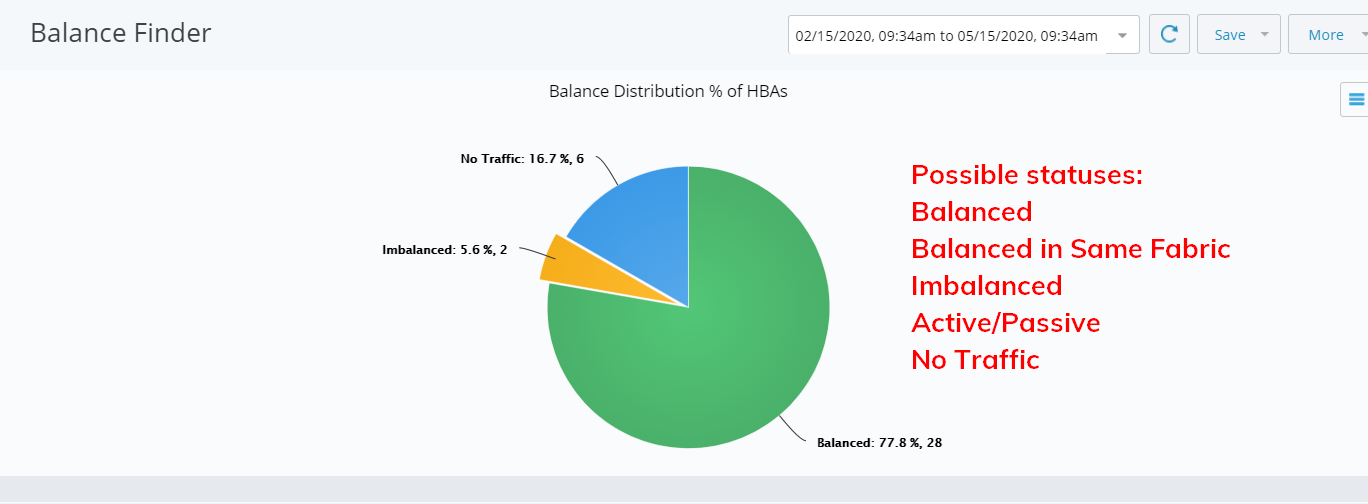
Balance Finder displays the results of its analysis in a pie chart at the top of the results page. The possible multipath statuses include balanced, balanced in the same fabric, imbalanced, active/passive, and no traffic.
The classification status, sub-status, and MB/s for each host are shown on the results grid. The Status column shows an aggregate of the status for all ports included with the server. Click on the down arrow to expand the results grid, show results by HBA, and display additional information (host port, switch, fabric, and metrics details).
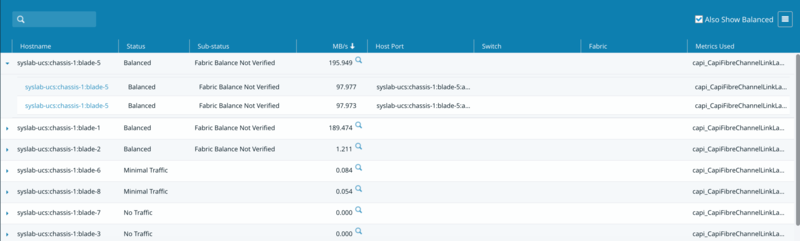
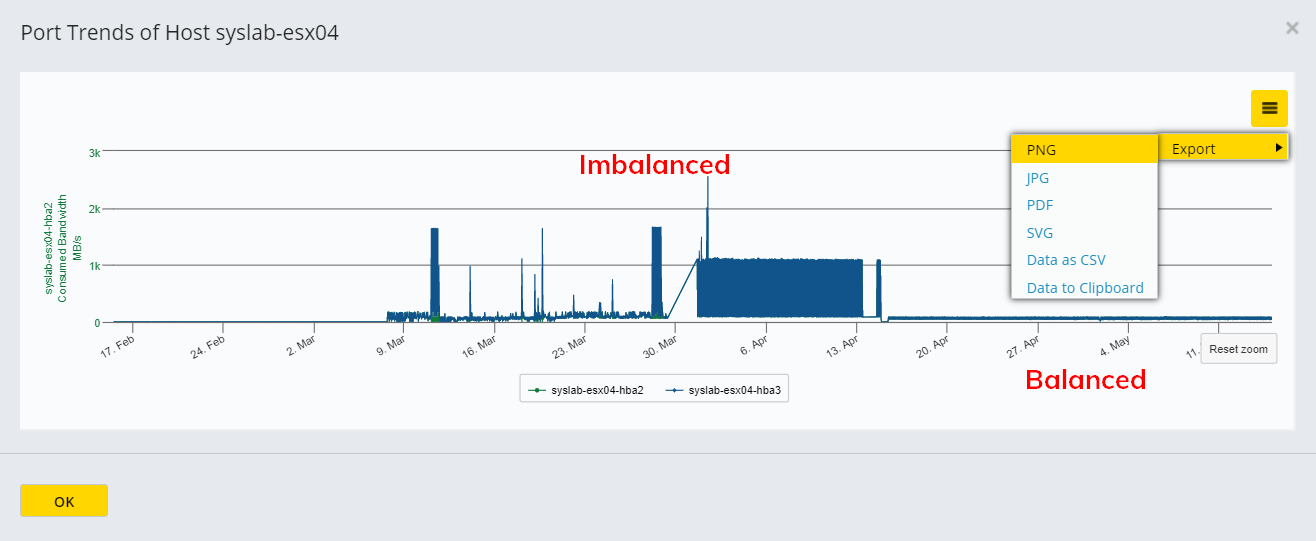
You can view the port trends for a host by clicking on the magnifying glass in the host's row. The workload trends for the host's ports are displayed in a pop up window. Like all charts, the chart can be exported by clicking on the hamburger icon then selecting Export.