Performance Snapshot Details of a Pod in a Node
Performance snapshot enables you to analyze the health of the Pod in terms of the network flow from a selected Pod and its container. It shows the performance of a particular pod in terms of resource utilization, like CPU, Disk, Memory, and Network.
 |
Performance snapshot lists the configuration details of a selected Pod.
The Config Map Details provides information regarding the Kubernetes Config Map associated with the selected pod or container.
This information is vital for troubleshooting, configuration validation, and understanding the environmental parameters injected into the application.
Click CPU to expand the section.
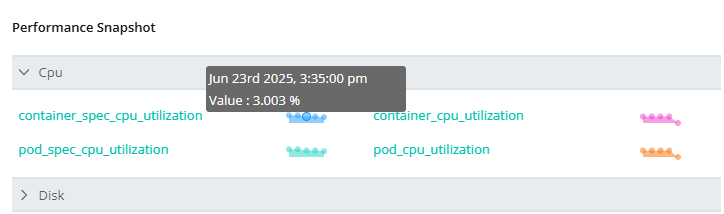
Hovering over the metric graph will display the amount of the network transmitted and received by a pod and its containers at each time interval.
Click on any entity.
It will display the entity's threshold details for a Pod.
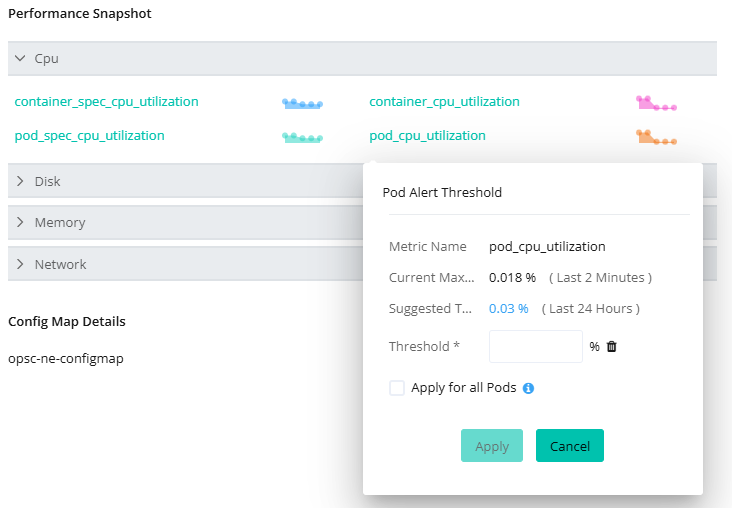
Pod Alert Threshold shows the metric name, current maximum value, and suggested threshold value of each metric.
Define the specific value in the input field provided for the Threshold*.
It notifies you of an alert when it exceeds the defined value.
Similarly, click on Disk, Memory, and Network to expand these sections.
Note
Similarly, you can also view the performance snapshot details of all the containers for a selected Pod.
You can also download the Config Map YAML configuration file for reference.
From Performance Snapshot, you can also view the Metrics, Logs, and Events of Pods.