Viewing the Performance Snapshot of each service operation
This topic helps you to view the performance snapshot details of an operation within a service, metrics, and the associated traces.
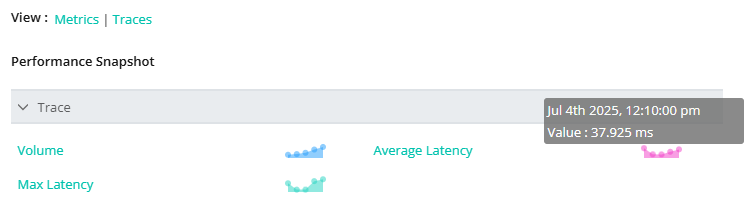
In Performance Snapshot:
Click Trace to expand the metrics of a service to monitor the performance.
Hovering over each metric graph will display the network data transmitted/received at each time interval.
Click on the metric to display the metric's threshold data for the service.
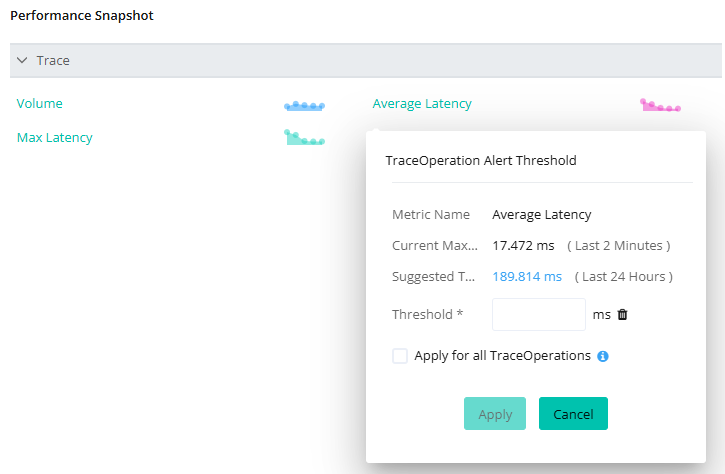
TraceOperation Alert Threshold shows the metric name, current maximum value, and suggested threshold value of each metric.
Define the specific value in the input field provided for the Threshold* and click Apply.
It notifies you of an alert when it exceeds the defined value.