Cases
Cases are used to group alarm events.
Cases let you handle issues that arise and are identified through alarms that are triggered based on the defined alarm rules. Cases are opened when an alarm is triggered and are comprised of groupings of alarms to minimize the noise-to-signal ratio.

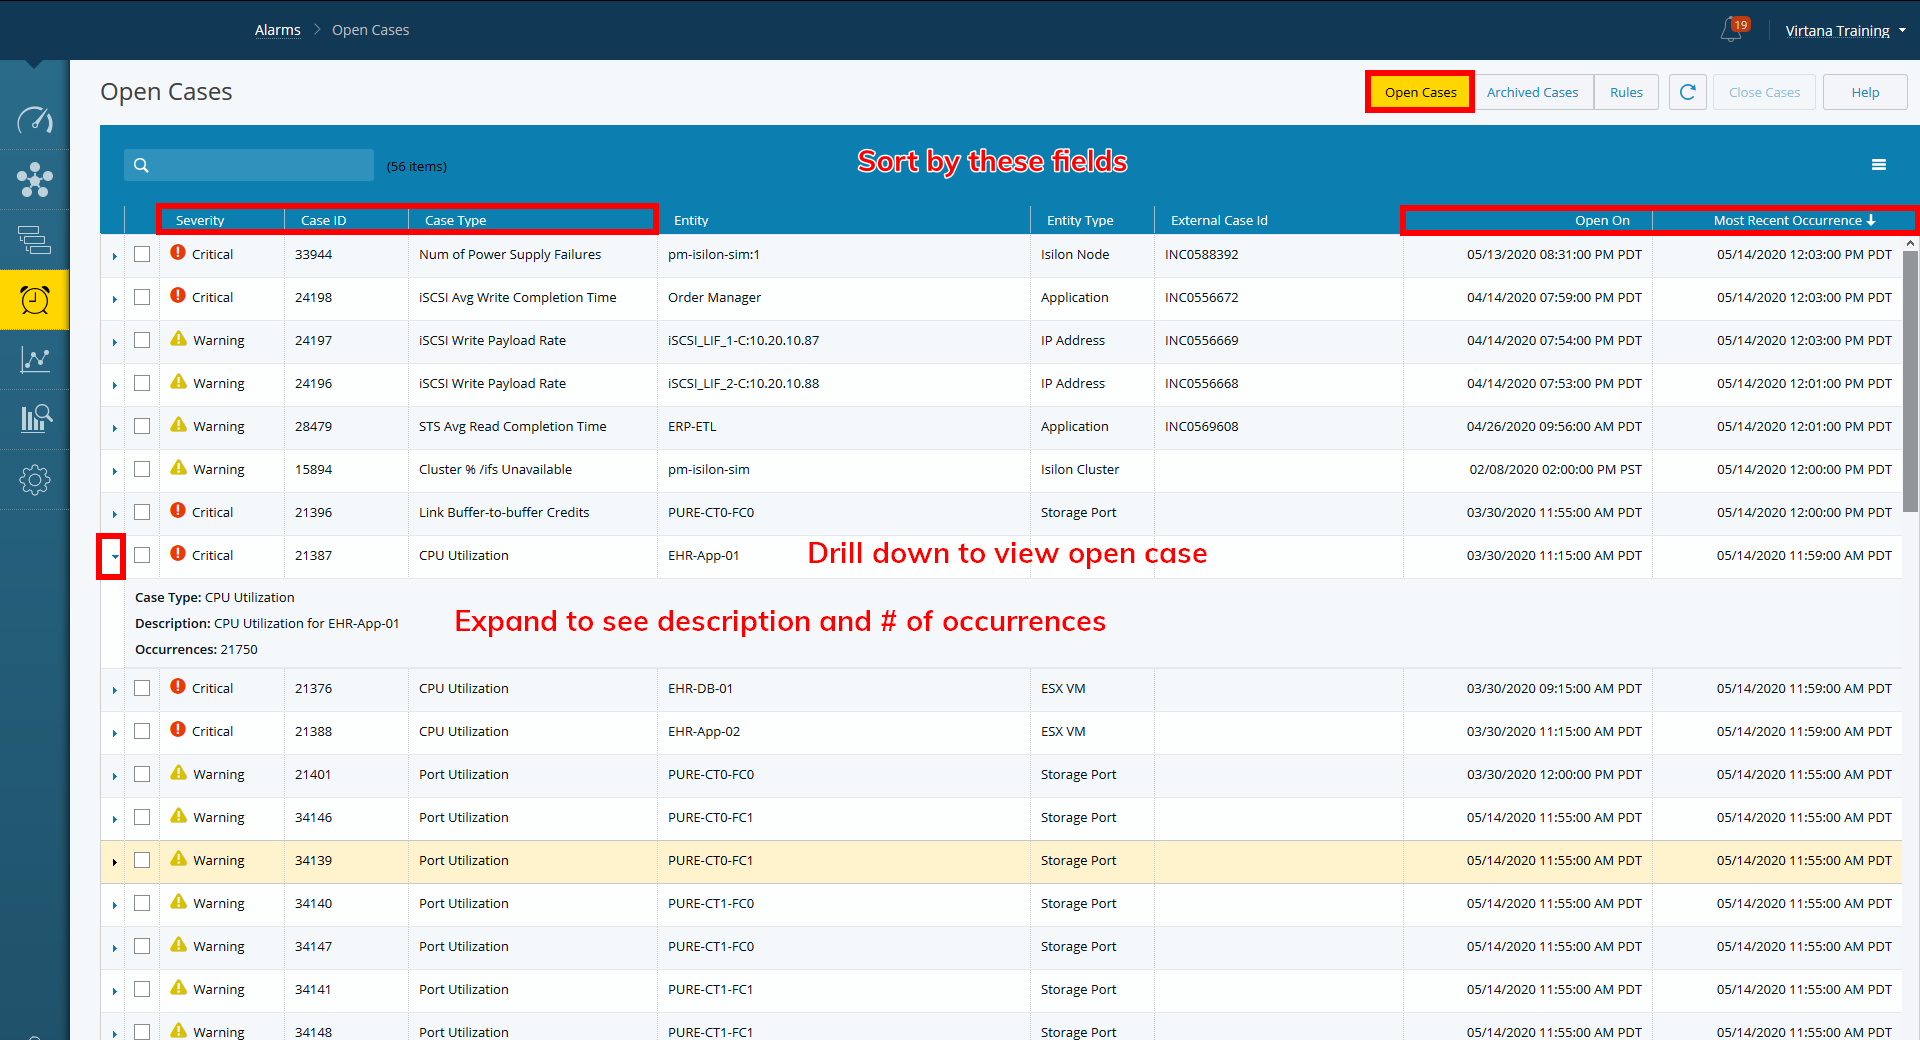
View open cases by selecting the Open Cases button. A list of all open cases is displayed, sorted by the Most Recent Occurrence date.
Column ID | Definition |
|---|---|
Severity | Alarm Severity |
Case ID | IO Case ID |
Case Type | IO Case Type NoteWhen Virtana IO receives an SNMP trap from a monitored device, it automatically generates a case. The Case Type for trap-generated cases is prefixed with "Trap" followed by the IP address of the source device, for example, "Trap 10.10.99.62". This prefix distinguishes trap-based cases from cases generated by alarm rules. |
Entity | Entity affected by the case |
Entity Type | Entity type affected by the case |
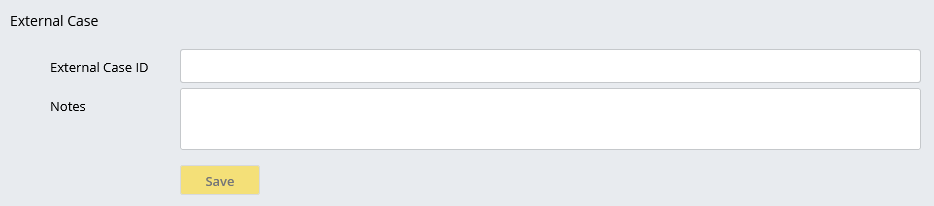
External Case ID | Text entry box for tracking a ticket number from an external ticketing system |
Open On | Date and time case opened |
Most Recent Occurrence | Last date and time case updated |
You can sort the list view by these fields: Severity, Case ID, Case Type, Open On, and Most Recent Occurrence. Click the down arrow to expand the row and view description and number of occurrences. Drill down on a row to view the open case.
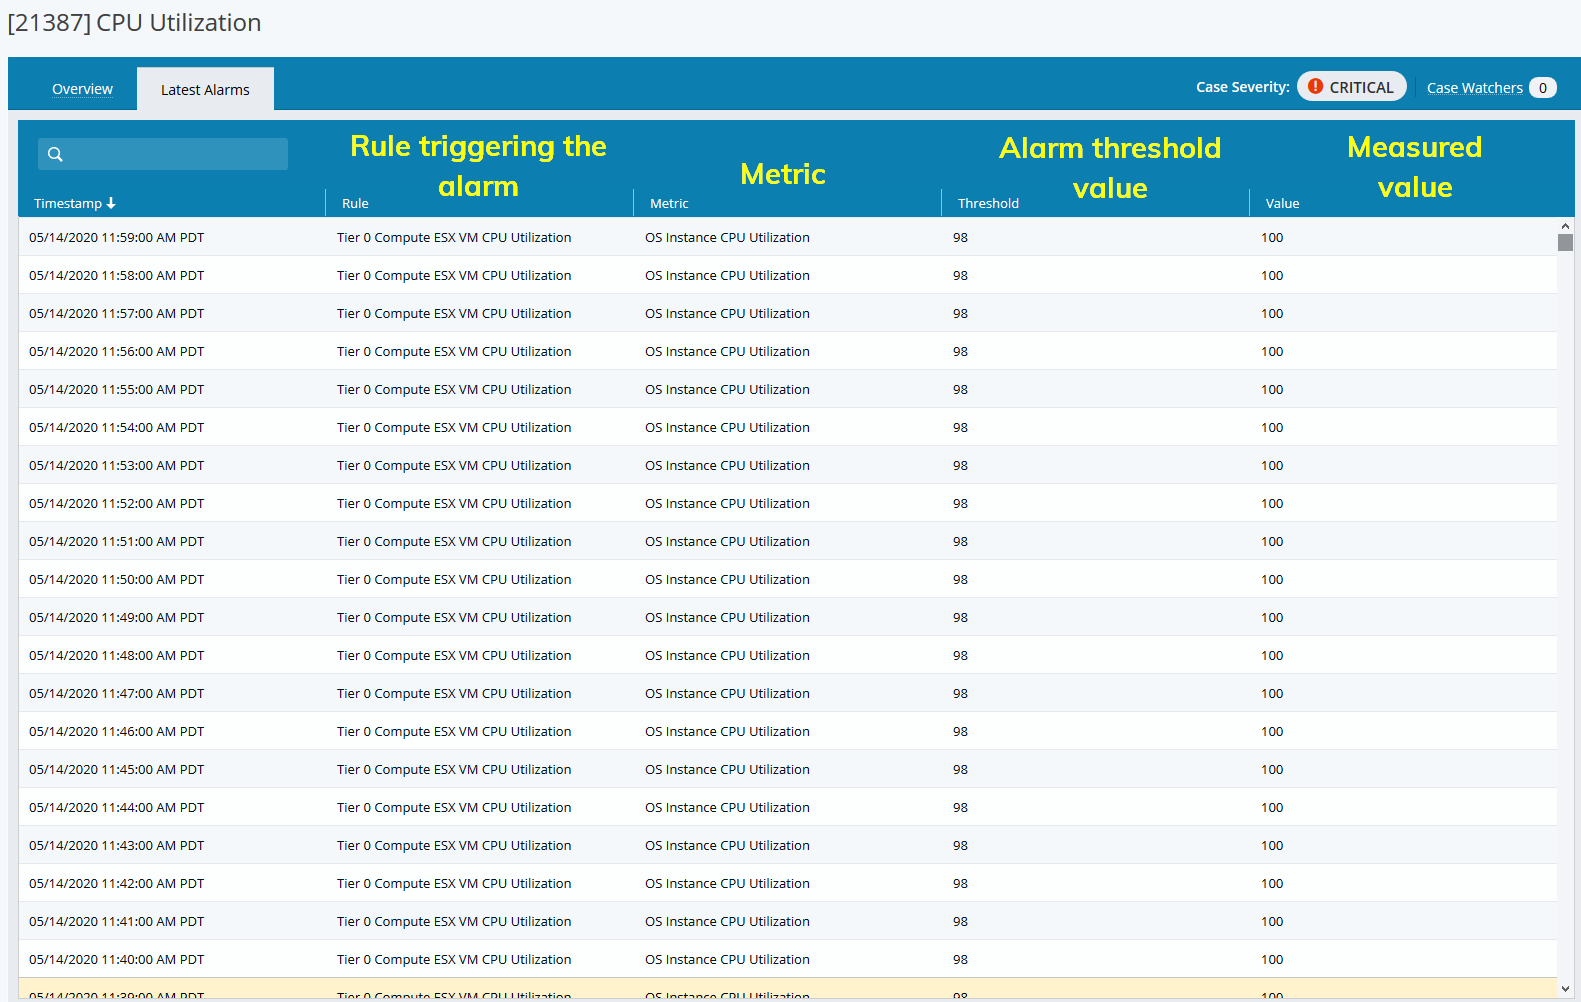
The Latest Alarms tab shows you a list of the most recent alarm events. It includes the alarm rule that triggered the alarm, the metric being monitored, the threshold, and the metric value that triggered the alarm.
Daily email summaries of open cases (the Alarm Digest) are sent to individuals with the IO-admin role every day at 5:00 AM. The email contains summary details of open cases and occurrence details for the last 24 hours. Closed cases are filtered from the view.
Email preferences for the Alarm Digest can be set in the user profile. Navigate to Preferences > Alarms, Case Management and Health.
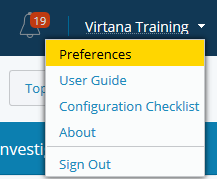
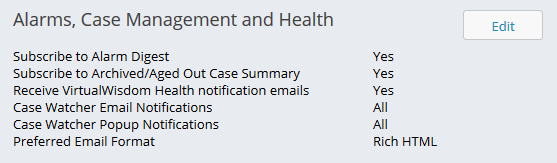
You can set your alarm notification preferences in Account Information.
Open Case Page
Overview Tab
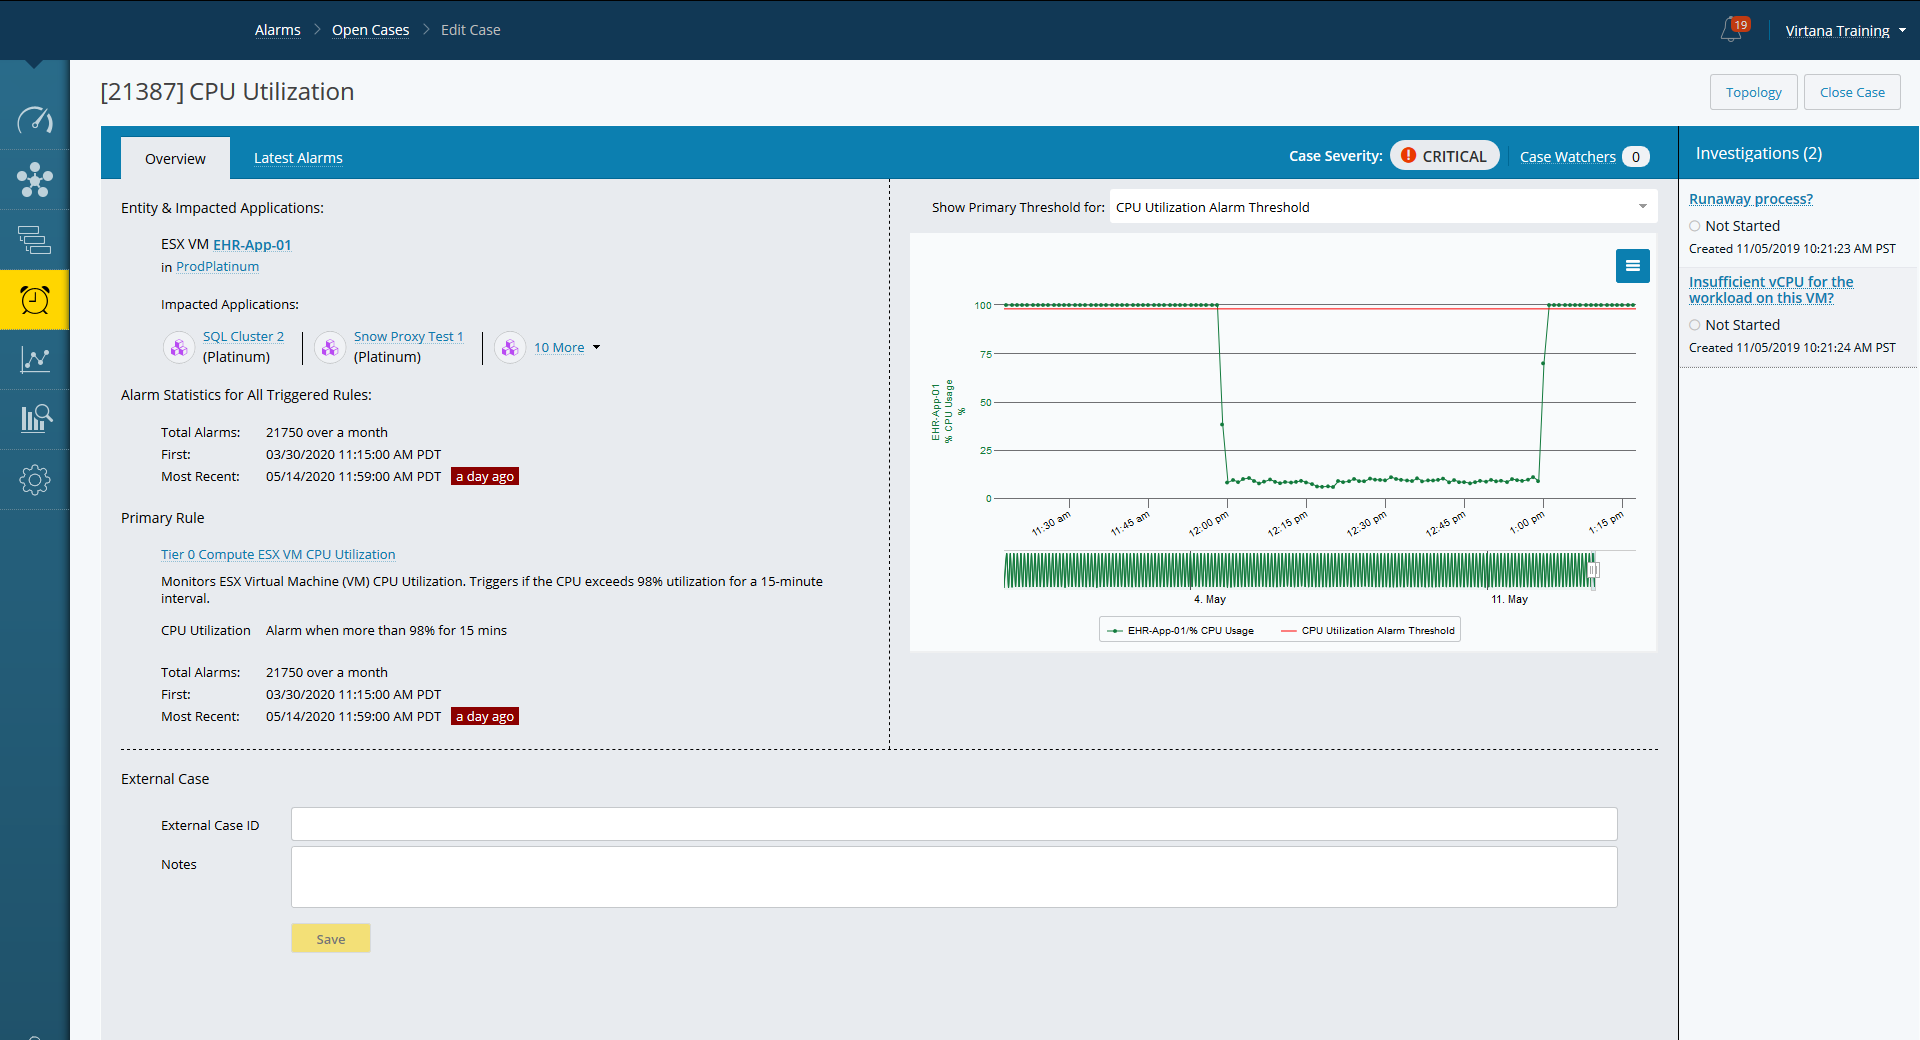
The Overview tab displays summary information for the open case. It displays the impacted entity, applications and tiers. It shows you statistics such as total number of alarms and first and most recent alarm date and time. It also shows you the primary rule that triggered the alarm along with statistics for that alarm rule.
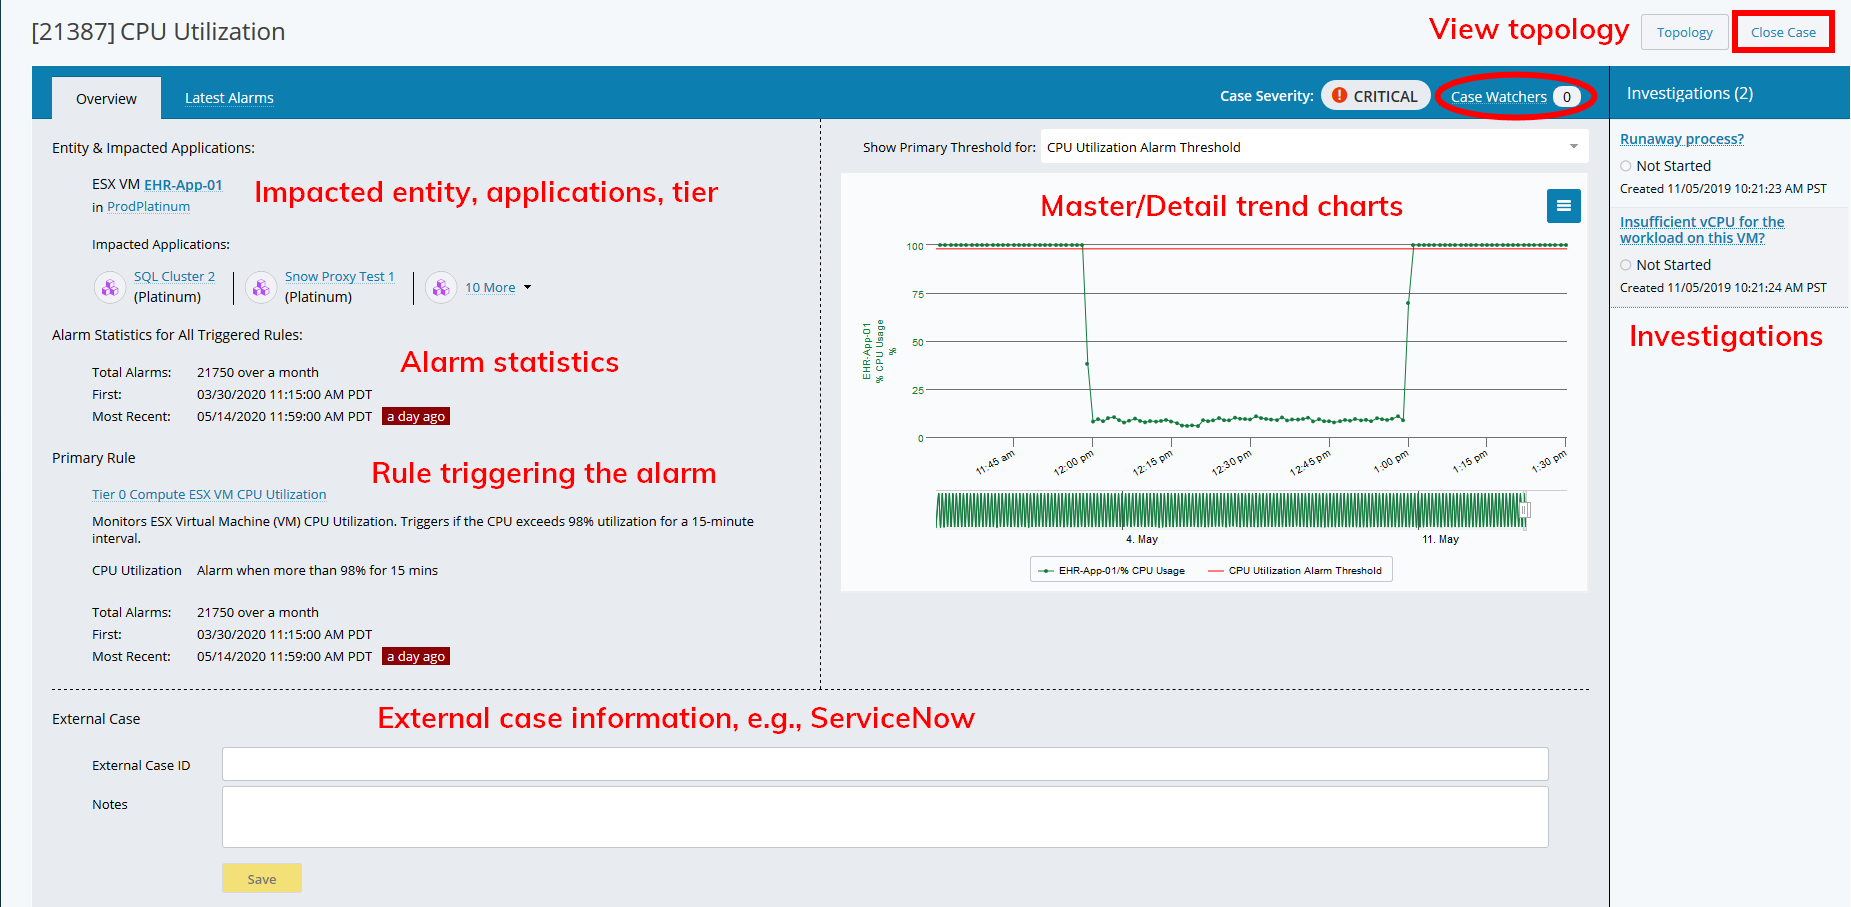
To the right, the Master/Detail Trend Chart displays a chart of the last alarm event and a chart below that displaying a 2-week summary of the data.
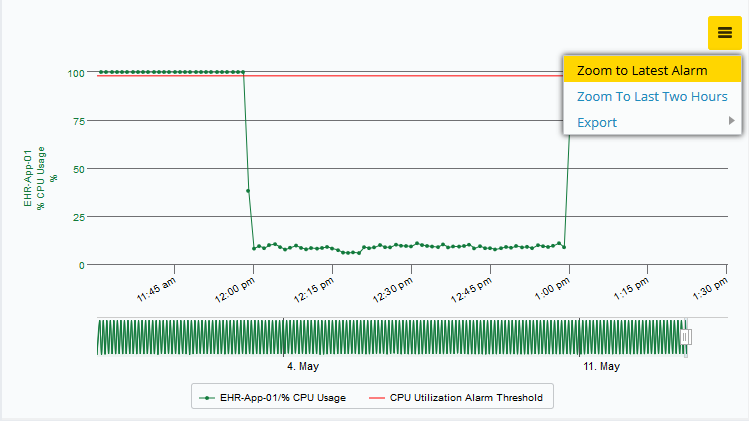
The Master/Detail Trend Chart shows you the alarm data for the last alarm event. Two hours of data are displayed by default. Under this chart is another chart that displays the last two weeks of alarm data to help you see when the issue started. You can also set the chart to show the latest alarm or the last two hours of data by clicking the hamburger icon and selecting Zoom to Latest Alarm or Zoom To Last Two Hours.
Use Export to export the chart data as a PNG, JPG, PDF, SVG, CSV or copy it to the clipboard.
At the top, the case severity is displayed and a link to see which users are watching the case. Click on Case Watchers to add your name or another user as a case watcher. Information on watched cases will appear in your notifications pane (click on alarm bell).
The Topology button takes you to a topology view of the impacted entity while the Close Case button lets you close the case.
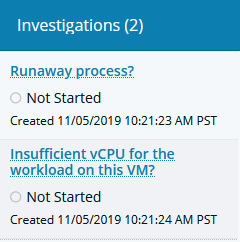
On the far right is a pane that displays investigation workflows designed to help you troubleshoot the alarm.
The external case section at the bottom provides information on incident tickets that may have been opened in an external system. IO opens tickets in ServiceNow and displays the external case information here if ServiceNow has been integrated.