Layer 2: Set up orchestration monitoring
Container Observability (CO) provides the orchestration layer for Virtana AIFO. It connects your AI agent application to the infrastructure it runs on by monitoring the Kubernetes environment where your workloads run.
Layer 2 orchestration: an AI agent application’s data reaches the Virtana platform through Virtana CO and through Virtana IO from registered GPU hosts.
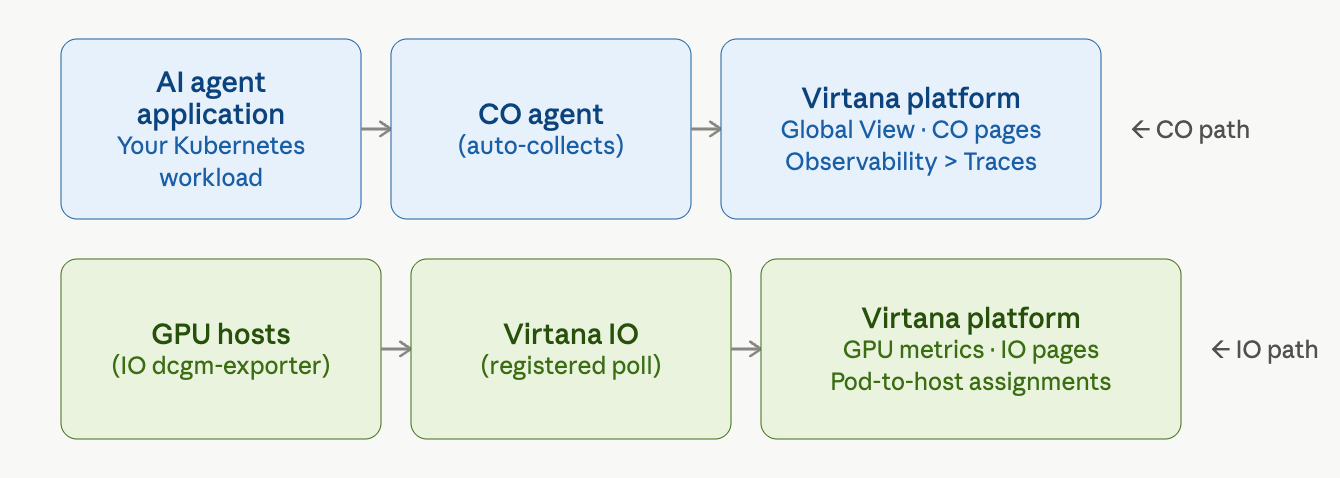
Layer 2 uses two data collection methods. Virtana CO pulls data automatically from your Kubernetes cluster. The NVIDIA Integration pushes GPU metrics from registered hosts to Virtana Infrastructure Observability (IO).
How it works
When your AI workloads run on Kubernetes, the Virtana platform uses Virtana CO to collect performance data from your cluster. Virtana CO monitors your pods, services, and workloads and sends that data to the platform, where you can see it in Global View and the Virtana CO pages.
For AIFO, Virtana CO provides the orchestration layer: the connection between your AI agent application and the infrastructure it runs on. When a user sends a request to your AI agent, Virtana CO tracks how that request moves through your Kubernetes services, which pods handled it, and how long each step took.
The platform connects Virtana CO data to infrastructure data through an infrastructure variable configured during Virtana CO installation. This linkage lets you see your AI workload performance alongside your underlying infrastructure in a single view.
Note
For Virtana CO installation steps, supported platforms, and configuration of the CO-to-IO infrastructure linkage variable, see the Container Observability deployment.
The following table describes the components involved in AIFO orchestration monitoring.
Component | Description |
|---|---|
AI agent application | Your application running on Kubernetes. Virtana CO monitors the pods and services that your agent uses. |
Virtana CO | Collects performance data from your Kubernetes cluster and sends it to the Virtana platform. Deployed and configured as described in the CO Installation Guide. |
CO-to-IO linkage variable | An infrastructure variable that connects Virtana CO data to Virtana IO. Configured during Virtana CO installation. NoteAs of CO 2026.6.1, this variable is fully dynamic. You don't need to set it manually. |
Virtana platform | Receives orchestration data from Virtana CO and makes it visible in Global View, the Virtana CO pages, and Container Observability > Traces. |
Why use the Virtana NVIDIA Gateway, not NVIDIA’s open-source collector?
NVIDIA’s open-source DCGM Exporter is designed to feed Prometheus-based stacks. To use it, you need Prometheus, Grafana, and additional scraping infrastructure. The Virtana NVIDIA Gateway is purpose-built for Virtana IO: it maps metrics directly to IO’s data model, supports both push and pull collection models depending on your network topology, and integrates with the Virtana entity and topology engine. No additional monitoring infrastructure is required.
In addition, the Virtana NVIDIA Gateway goes beyond GPU metrics. It collects and aggregates process information, configuration data, and detailed relationship information that NVIDIA’s open-source tooling either omits or requires manual correlation to produce.
Verify that orchestration data is visible
After Virtana CO is installed and running, confirm that your Kubernetes workloads and AI agent services are visible in the Virtana platform.
Sign in to the Virtana platform.
Navigate to Global View > Topology. Confirm that your Kubernetes clusters, nodes, and workloads appear in the topology view.
Navigate to Container Observability and confirm that container performance metrics are flowing for your AI agent services.
Navigate to Observability > Traces and confirm that traces from your AI agent appear. If you have not yet configured agent tracing, see Layer 1: Configure AI agent tracing.
View infrastructure details from an alert
When Virtana CO and the NVIDIA Integration are both running, you can navigate from an alert directly to the infrastructure view for the affected resource. This lets you verify GPU assignments, host mappings, and deployment configuration without leaving the alert investigation workflow.
Before you begin
Confirm that Virtana CO is deployed and that the NVIDIA Integration is configured in IO with at least one registered GPU host. See Set up the NVIDIA Integration in IO.
To view infrastructure details for an alerted resource:
On the Alerts Dashboard, select the container environment from the source dropdown, for example,
aifo-factory.Select the alert you want to investigate. The Alert Details page opens. The page header displays the alert threshold, age, status, and priority.
Select the Analyze tab. The High Latency Path diagram shows which services are involved in the alert and the latency between them.
In the lower panel, select the pod you want to inspect. The pod metadata panel opens and shows configuration details including hostname, host IP, deployment name, and namespace.
Under Telemetry, select Infrastructure. Virtana IO opens and displays the infrastructure view for the selected resource.
The infrastructure view shows the following fields.
Field | Description |
|---|---|
Hosted AI model | The AI model running on this host, for example, |
Cluster | The cluster the host belongs to, for example, |
Deployment type | The deployment region, for example, |
FQDN | The fully qualified domain name of the host. |
Advertised GPU utilization (%) | GPU utilization across percentile columns for the selected time window. |
All programs on this GPU | Other NVIDIA programs sharing the same GPU, with their process GPU usage. |
Use the time range selector at the top of the page to adjust the data window if needed.
Note
The Infrastructure tab is available only for resources that Virtana IO has discovered through the NVIDIA Integration. If the tab is not visible, confirm that the host is registered and that the NVIDIA Integration has completed at least one successful poll.