
Predictive Capacity Management Analytics

Predictive Capacity Management analytics forecast your capacity needs using the same solution that monitors your workloads.
capacityforecast.png

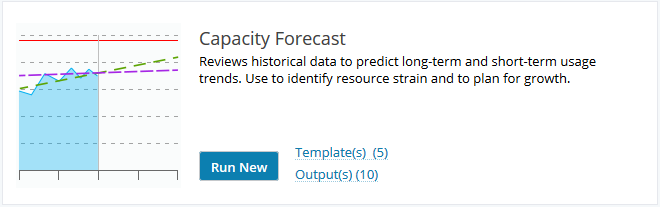
The Capacity Forecast analytic reviews historical resource usage data to predict short and long-term usage trends. Capacity Forecast can be used to identify resource strain before it leads to performance and availability issues, and to plan for future infrastructure growth to support critical business applications.
vmdeploymentadvisor.png

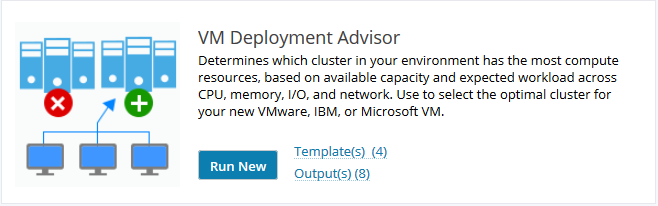
The VM Deployment Advisor analytic optimizes the deployment of new Virtual Machines by examining historical usage and identifying which cluster and VM to deploy workload on for optimal performance and balance. The analytic uses historical usage to determine how a new VM will have to fit in terms of CPU, Memory, Network and Disk Usage.
capacityauditor.png

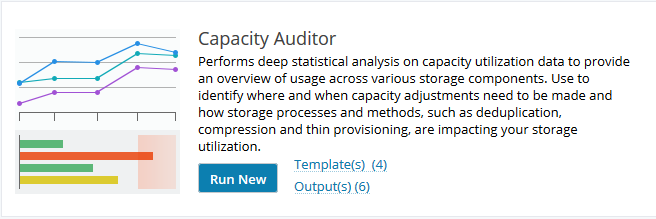
Capacity Auditor performs deep statistical analysis on capacity utilization data to provide an overview of usage across various storage components. Use Capacity Auditor to identify where and when capacity adjustments need to be made and how storage processes and methods, such as deduplication, compression and thin provisioning, are impacting your storage utilization.

Capacity Forecast

Capacity Forecast reviews historical usage data to predict short and long-term usage trends. Use Capacity Forecast to identify resource strain before it leads to performance and availability issues, and to plan for the growth required to support critical business applications.

Running Capacity Forecast

  1. Start by running a new Capacity Forecast from the Analytics home page.

    capacityforecast.png
  2. Select an entity type to analyze from among Compute, Network, and Storage entities.

    capacityforecastselectentity.png
  3. Check the box to use advanced options. You can adjust the forecast thresholds, select the metrics you wish to analyze, and change the percentile value to base the forecast on.

    capacityforecastadvancedoptions.png
  4. Run Capacity Forecast for a minimum of 6 months. Using a longer date range is recommended. You can run the analytic in the background and review its output later the Outputs page.

    capacityforecastdaterange.png

Understanding Capacity Forecast Results

The results are displayed in panes below the settings pane. The topmost panel shows a summary of the results, letting you quickly pinpoint where there may be an issue.

capacityforecastsummary.png

The summary pane shows potential issues with disk space usage on this host. The details are shown below on the Disk Space Usage Details pane. 5 datastores may reach the limit of their usage within 180 days.

capacityforecastdiskspaceusage.png

The data shown will vary based on the entity type analyzed. Shown above is the data analyzed for a storage array.

capacityforecaststoragearray.png

VM Deployment Advisor

VM Deployment Advisor identifies the optimal cluster and host to which to deploy a VM, based on available capacity and expected VM workload across CPU, memory, I/O, and network.

A VM Deployment Advisor analytic tells you how many more VMs fit in each host, and in turn, each cluster. You can sort by Cluster Name, or by availability. The clusters can be color coded for vacancy amount. The size of the VM and the maximum fill point are hidden by default but an advanced user can adjust these parameters. Each Cluster has a link to VM Coordinator such that it can be launched to reorganize that cluster. Each cluster has a dropdown to reveal the host occupancy.

This analytic is used with the VM Coordinator analytic.

Running VM Deployment Advisor

  1. Start by running a new VM Deployment Advisor by clicking the New Analytic or Run New button.

    vmdepadv1.png
  2. Specify the Cluster Type (ESX, Hyper-V, or PowerVM).

    vmdepadv2.png
  3. If you check the Use Advanced Options box, you can specify desired resource limits for CPU, memory, disk and network throughput.

    vmdepadv3.png
  4. Run the analytic for the past seven days or longer.

    vmdepadv4.png
  5. Click Run.

Understanding VM Deployment Advisor Results

  1. VM Deployment Advisor displays its results in a table presented below the settings pane.  Included are the names of the clusters and the total number of VM slots available.

    vmdepadv5.png
  2. An exclamation point next to the cluster name indicates that the host is already over-provisioned. Click the down arrow on the left side to expand the information displayed for the cluster.

    vmdepadv6.png

    The Available VM Slots field shows you which of the hosts in the cluster have available slots and how many are available. You may see the work Over displayed next to the hosts that VM Deployment Advisor has determined are over-provisioned.

    Click on Coordinate to run VM Coordinator to address the over-provisioning situation. You can also access VM Coordinator from the drop-down menu associated with the down arrow on the right.

    vmdepadv7.png
  3. To save the move recommendations, click on the hamburger icon in the header and export them to a csv file, or copy to the clipboard.

    vmdepadv8.png

Capacity Auditor

Capacity Auditor considers how storage processes such as deduplication, compression, and thin provisioning are impacting your storage utilization and identifies where and when capacity adjustments need to be made to storage.

Capacity Auditor shows you capacity data and trends for your PowerMax and Isilon storage arrays.

Running Capacity Auditor

  1. Select Run New Capacity Auditor from the Analytics home page.

    analytics-capaud1.png
  2. Set Capacity Auditor parameters.

    1. Choose whether to group the storage arrays by a property.

      analytics-capaud3.png

      Tip

      You can define Custom properties for storage arrays and use them in the analysis.

    2. To analyze a subset of arrays, use the filter to select one or more named storage arrays. You can filter for storage arrays in/not in a specified list, related to other entities, or with a specified property.

      filterstoragearrays.png
      analytics-capaud4.png
    3. Select threshold values for red/yellow severity warning levels.

      analytics-capaud5.png
  3. Choose a date range. You should run the analytic for the past twelve months, if data is available, then monthly thereafter.

    analytics-capaud6.png
  4. Click Run to run the analytic.

Understanding Capacity Auditor Results

Capacity Auditor results are displayed in three sections on a single page.

The first section shows you usage statistics for the storage array(s).

analytics-capaud7.png

The middle section displays a trend chart showing monthly trends for capacity for the storage array(s).

analytics-capaud8.png

The bottom section displays more details about the selected storage array grouping.

analytics-capaud9.png

Rows display details for each storage array, including the time to reach the "red" capacity threshold chosen for the analysis. Changing this threshold changes the forecast.

To view details for a previous analysis, click the date and select a previous snapshot.

capaudprevsnap.png

To view results for a different property value, click the value and select from the list.

capaudotherprop.png