Cost Management Overview Dashboard
You can access the Cloud Cost Management (CCM) overview dashboard section in the Virtana Platform console. Using various filtering options, you can segment your cloud environment so you can view only the subset of cloud spend relevant to a specific application or business unit.
You can also analyze costs in multiple ways. For example, you can compare your cloud costs for the current month and previous months, as well as identify whether costs are trending up or down.
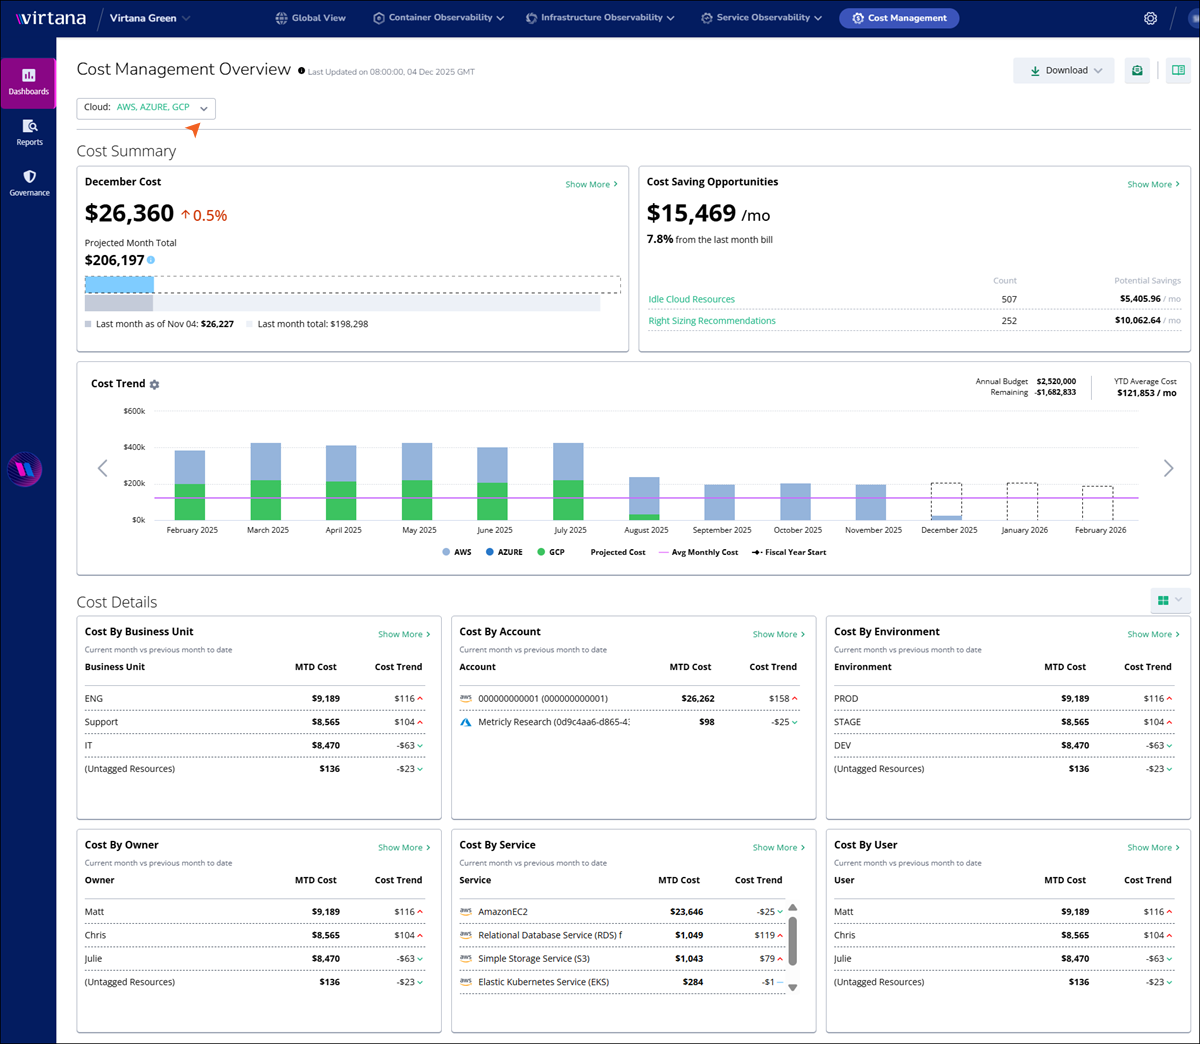
Click the cloud selector at the top of the dashboard to choose a cloud provider. You can view the corresponding data in the Summary section.
Note
Support for GCP is currently an Early Access feature. It is available to all Virtana Cloud Cost Management customers. Contact your Account Representative or cloudcostsavings@virtana.com to enable GCP for your account.
Cost Summary Section
In Cost Summary, you can view a snapshot of your overall cloud costs. There are various ways that you can filter the data you are viewing. You can also filter the data by cloud provider, resource group, and time period. For example, you can manage the filter selection if you want to view the cost data for the AWS service for 15 days.
You can view the following panels under the Cost Summary:
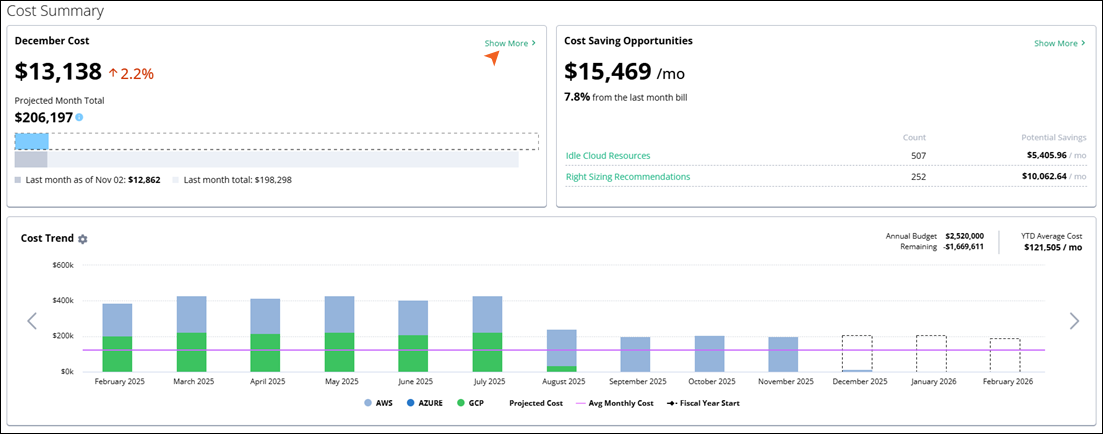
Monthly Cost card
The Monthly Cost card compares the current month's cost-to-date expenditure in your default reporting currency, alongside the previous month’s total cost and a calculated delta that highlights both the absolute and percentage change in spend compared to the same period last month. You can view more details about the current month's costs by clicking Show More.
It prominently provides a real-time, consolidated snapshot of your organization’s total cloud spend for the current month, aggregating costs across all connected cloud providers and accounts.
Cost Saving Opportunities
In the Cost Saving Opportunities section, you can gain valuable insights into potential savings for your cloud resources. Here, you can identify those areas where you can optimize your cloud costs and reduce your monthly expenditure.
On the dashboard, you can see:
Number | Component | Description |
|---|---|---|
1 | Total Monthly savings and last month's comparison | It represents your potential monthly savings. Current Cost gives you a comparison of the current month's and the previous month's overall cost in US dollars. Also indicates the percentage that costs have increased or decreased. A red upward arrow indicates increased costs, and a green downward arrow indicates decreased costs. |
2 | Show More | You can select Show More to get an in-depth breakdown of potential cost savings. |
3 | Idle Resources | It displays in US Dollars how much you can save per month by eliminating unused cloud resources, along with the percentage of increase or decrease compared to last month. |
4 | Right Sizing | It indicates the monthly cost savings in US dollars that would result from modifying your resources per the recommendations, along with the percentage of increase or decrease compared to last month. |
Cost Saving Opportunities Side Panel
From the Cost Saving Opportunity dashboard, you can click Show More on any card widget to access a side panel with more details. On the Bill Analysis fly-out, side panel, you can choose different filtering options using Filters such as Filter by Account, Filter by Group, and Filter by Resources. These filters provide a way to adjust the report data to get a more precise view of your cloud cost providers. You can now filter the CSO widget by Account or Resource Group.
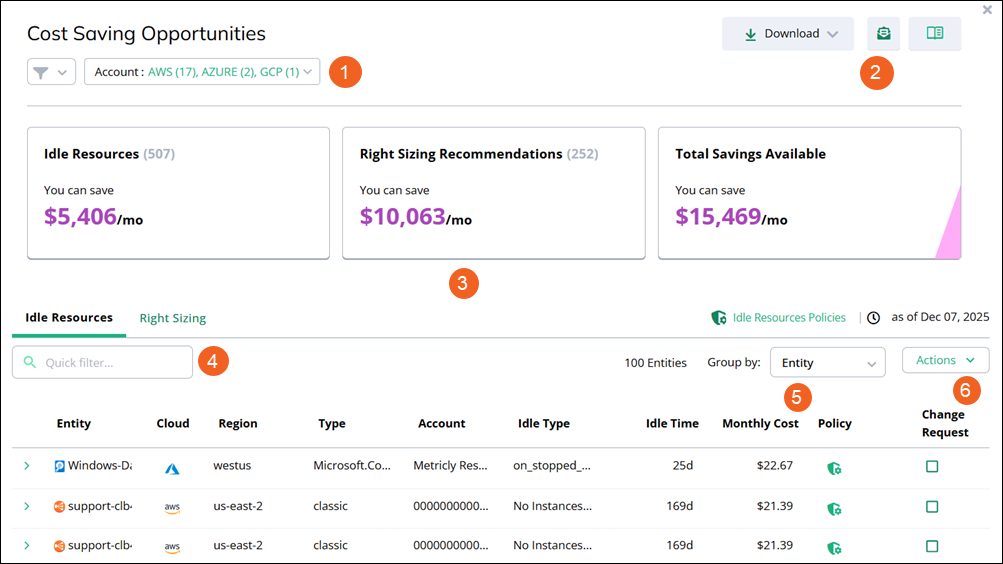
Number | Component | Description |
|---|---|---|
1 | Cloud Platform Account | Use the top-level filter to determine which cloud platforms or other segments are included in your view. This serves as the overarching filter for the entire system. |
2 | Utility access |
|
3 | Cost Cards |
|
4 | Quick Filter Search box | The Quick Filter search box is designed to search for high-level items, including options like filtering by services, filtering by accounts, and browsing through resources. |
5 | Group By | To effectively manage your resources, you can utilize the Group By feature to organize them based on either Account or Resource Group. By default, the report is structured by Entity, displaying all recommendations. To gain a summarized overview of savings for each Account or Resource Group, simply click the arrow icon adjacent to the respective Account or Resource Group. This action will highlight all the recommendations linked to that particular Account or Resource Group. For more detailed insights on a specific recommendation, you can click the arrow icon next to that individual recommendation. |
6 | Action | Click Action to create all change requests, or you can create change requests for selected entities. |
Cost Trend Chart
The Cost Trend panel offers a 13-month view of data, providing predictive insights into future expenses through artificial intelligence-driven cost estimation and trend analysis. The bar chart within this panel visually compares monthly costs with average monthly costs and presents a projected total cost for the current month. By hovering over any bar, you can access a pop-up displaying the total cost, cost change, and projected cost.
This 13-month trend provides users with predictive insights into future expenses. It relies on artificial intelligence for cost estimation and trend analysis.
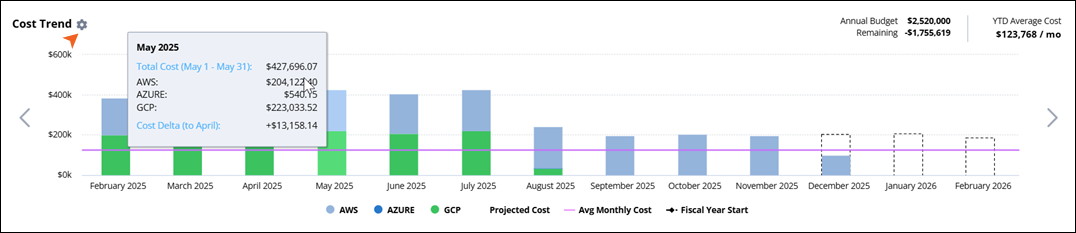
You can zoom in on a section of the chart by clicking and dragging your cursor across an area of the chart. A Reset zoom message box opens so you can return to your previous view.
Set-up Cost Trend
Click on the Cost Trend Settings.
The Forecast Parameters window opens.
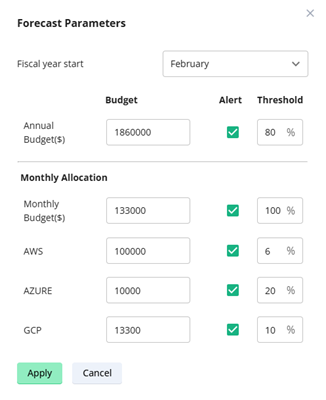
Set up Forecast Parameters by specifying the fiscal year start.
Enter the Annual Budget amount (in $), select the checkbox to enable the alert, and update the threshold percentage to get an alert for exceeding limits.
Similarly, update the fields for Monthly Budget, AWS, AZURE, and GCP.
Caution
Make sure that the total budget of AWS, AZURE, and GCP does not exceed the monthly budget.
Make sure that the monthly budget does not exceed the annual budget.
Verify the settings for accuracy and click Apply for the changes using the software's interface.
Managing cost threshold alerts in the Cost Management Overview Dashboard
The Cost Trend widget allows you to set annual and monthly cloud budgets and define threshold values. When your cloud spending crosses these limits, CCM automatically generates alerts. These alerts help you monitor overspending and take corrective action quickly.
Purpose of Cost Threshold Alerts:
Help you track and control cloud costs across AWS, Azure, and GCP.
Provide early warnings when spending exceeds expected limits.
Allow you to allocate budgets based on your cloud strategy.
Give you visibility into which provider or month is exceeding the budget.
There are five primary types of Cost Breach Alerts used for budget tracking are defined as follows:
Alert Type | Definition and Scope | Configuration Context |
|---|---|---|
Total Cost Breach | Triggers when the total accumulated cost for the defined fiscal year (or 12-month period) exceeds a pre-set annual budget threshold. | Configured at the highest organizational or consolidated billing level, scoped for yearly budgets. |
Monthly Cost Breach | Triggers when the total spend for the current calendar month (or custom period) is projected to exceed, or has already exceeded, a defined monthly budget threshold. | Configured to track monthly cost trends, allowing for timely action to curb unexpected costs. |
AWS Cost Breach | Triggers when the aggregated spend specifically across all linked AWS accounts exceeds a defined budget or shows an unexpected cost surge for a set period. | Configured by filtering costs specifically by the AWS Cloud Provider against a spending limit. |
Azure Cost Breach | Triggers when the aggregated spend specifically across all linked Microsoft Azure subscriptions exceeds a defined budget or threshold. | Configured by filtering costs specifically by the Azure Cloud Provider against a spending limit. |
GCP Cost Breach | Triggers when the aggregated spend specifically across all linked GCP services exceeds a defined budget or threshold. | Configured by filtering costs specifically by the GCP Cloud Provider against a spending limit. |
Refer to Alerts to check the Alerts dashboard.
Tip
Due to chart scaling, some data might not display in the chart when the data point is too small. If you don't see data in the chart that you expect to see, use the legend under the chart to filter the data.
Cost Details
The Cost by cards provides a breakdown of cloud cost based on various groupings, such as Business Unit, Application, Service, Account, or Resource Group. They display the top five resources by cost.
Tip
To display cost data for Business Unit and Application, you must configure the Resource Groups under Settings. Data on other widgets will display automatically.
The information provided on each card includes the name or type of resource, the month-to-date cost per resource, and the cost trend. Cost trend indicates whether costs are trending up or down compared to the previous month. A green down arrow indicates costs have decreased, while a red up arrow indicates increasing costs.
Selecting widgets in Cost Details
In Virtana's Cost Details section, you have the flexibility to select which widgets you want to display. The widgets you choose will automatically adjust in size to occupy the entire row width. It's essential to understand that the widget selections you make will be applied to all users within your account, ensuring consistency in the information presented.
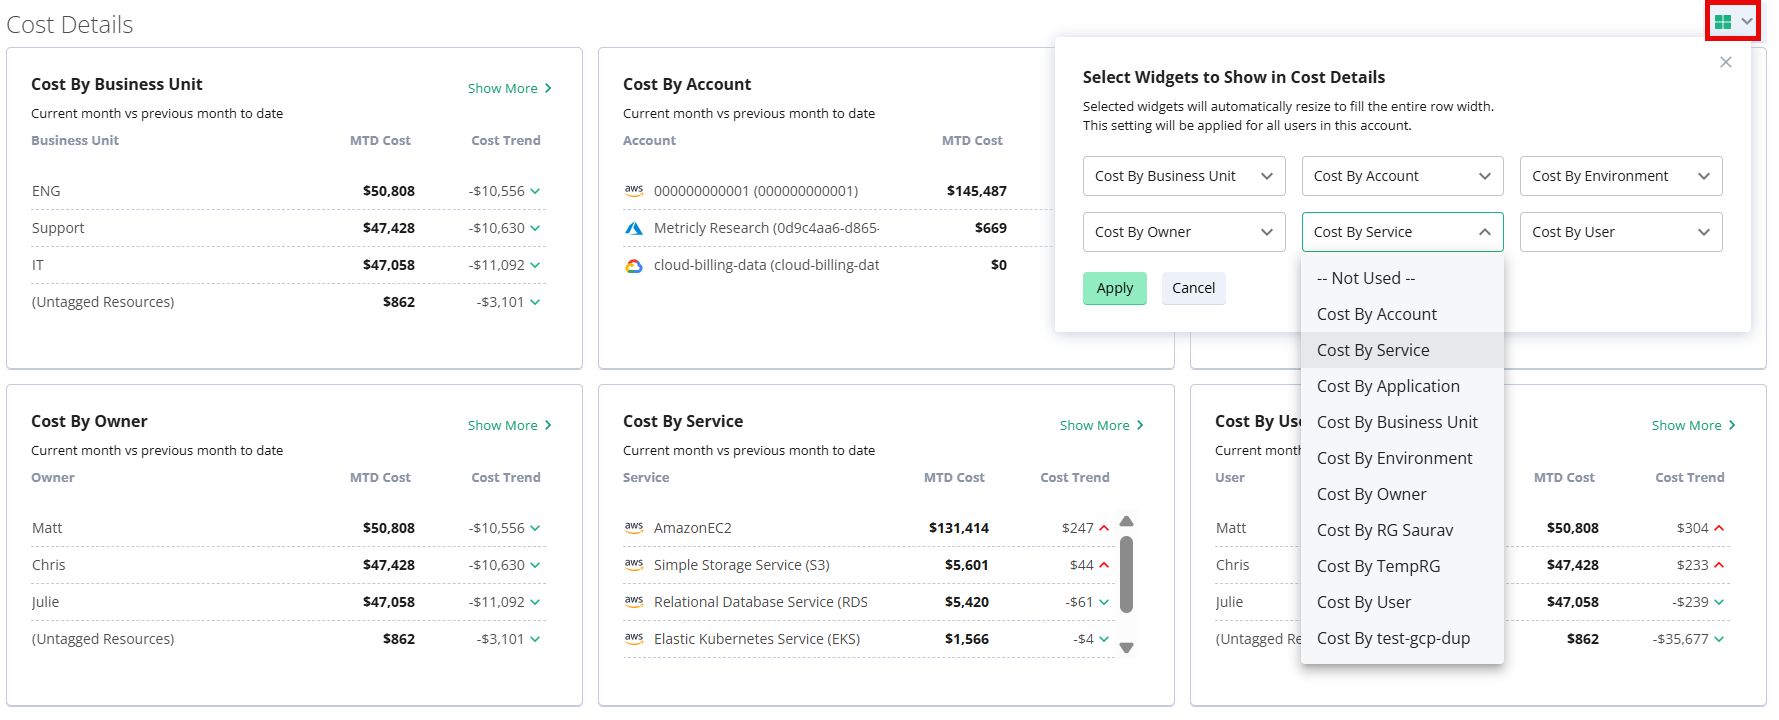
Follow the steps to select the Widgets:
Click the Widget icon.
The Select Widgets to Show in Cost Details window opens.
Click on the dropdown of any widget to get the list of widgets.
From the available widgets, select the ones that are most pertinent to your analysis and decision-making process.
Click Apply to save the customized settings.
Click Cancel if you want to discard any changes and return to the previous configuration.
Bill Analysis Side Panel
In the Overview dashboard, you can click Show More on any card widget to view more details.
On the Bill Analysis fly-out, side panel, you can choose different filtering options using Filters such as Filter by Account, Filter by Group, Filter by Resources, and Group Costs by selectors. These selectors provide a way to adjust the report data to get a more precise view of your costs. These filters provide a way to adjust the report data to get a more precise view of your cloud cost providers. You can now filter the CSO widget by Account or Resource Group.
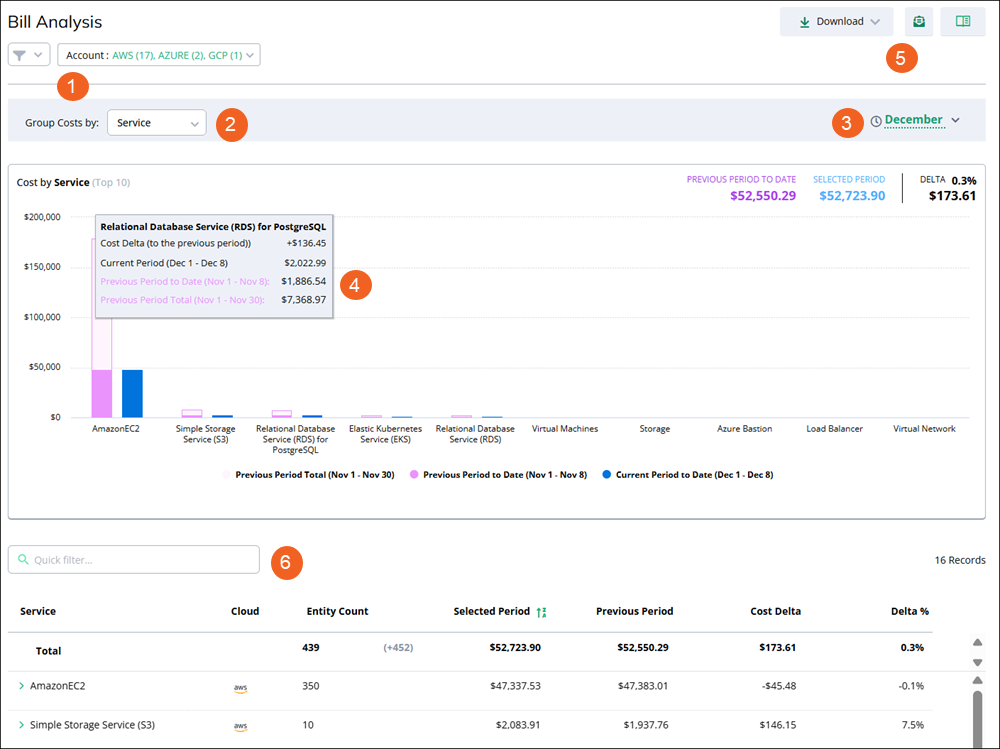
Number | Component | Description |
|---|---|---|
1 | Account and Filter |
|
2 | Group Cost By | These selectors provide a way to adjust the report data to get a more precise view of your costs by service and cost by accounts. Users can categorize resources either by Service or Account. Depending on the chosen grouping method, users can delve into individual resource details. |
3 | Time Range | You can also use the time range selector to choose from a list of time ranges or set a custom date range. The report can display data for up to 13 previous months. |
4 | Graph section | Graph provides a clear, comparative view of cloud service costs over time, helping you quickly identify major cost drivers, trends, and anomalies in your cloud spend across AWS, Azure, and GCP accounts. |
5 | Utility access |
|
6 | Quick Search box | For a quick search, enter the required entity in the Quick Filter search box. |
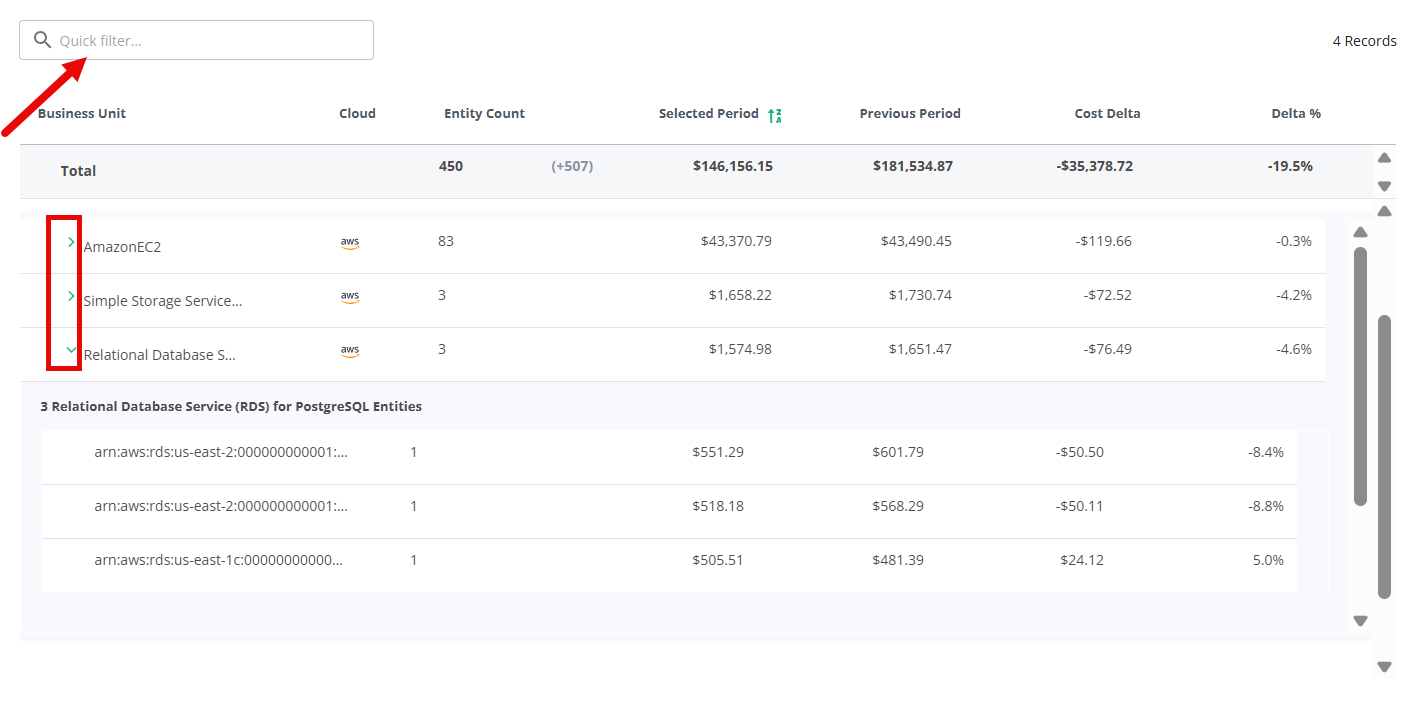
Quick Filter Search box
Use the Quick Filter search box to find the required entity. To help you with your search, you can filter by services or accounts or browse resources. As you’re searching, select Group by Service to display a list of services. Click each service to expand and explore related resources within that category.
These filters and selections are not persistent. Additionally, they do not impact the filters set on the main Overview dashboard.
The Bill Analysis panel displays data in both a chart and a table. In the bar chart, move your cursor over any bar to see a pop-up with details. These details include Cost Delta (previous period to the current date), Current Period, Previous Period to Date, and Previous Period Total. You can also use the Actions (hamburger) menu for view, print, and download options.
You can zoom in on a section of the chart by clicking and dragging your cursor across an area of the chart. A "reset zoom" pop-up allows you to return to the standard display.
In the Bill Analysis table, you can view the following details:
Service type
Cloud type
Entity Count
Current Period total cost
Cost from Previous Period to Date
Cost Delta from the previous month to the current month
Delta %
Previous Period Total cost
The table can be reordered by clicking on most column headers.
Note
You may find different entity counts due to the Group by Clause used in the Select query. While the cost remains unchanged, the entity count may vary.
Manage your scheduled emails
Cost Management Overview lets you control the automated email delivery of cost reports and dashboards. You can add and review existing scheduled emails, update their configuration, pause or resume delivery, and remove schedules that you no longer need.

Add Cost Saving Opportunities
Navigate to the Email Panel.
The Scheduled Cost Reports window opens.
Click Add Scheduled Report and select the Cost Saving Opportunities.
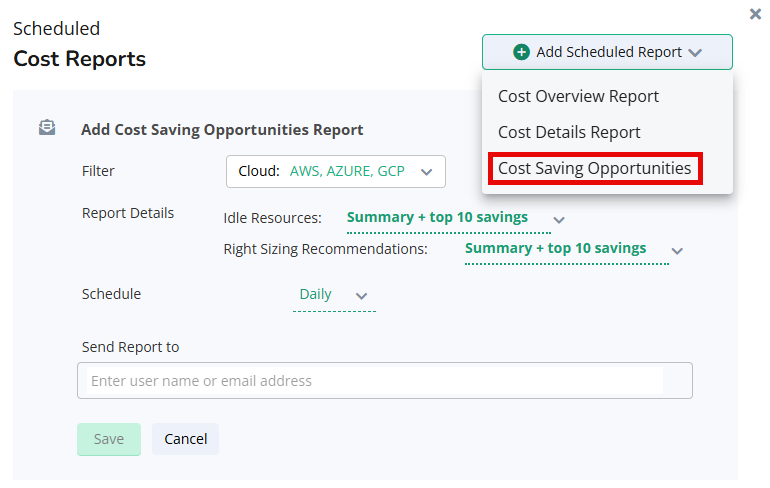
Configure your report settings as needed.
Click Save to add your report to the list in the Scheduled Cost Report window.
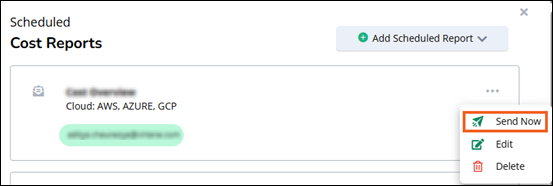
You can review your report and click Send Now/Edit/Delete following your action.
Add Cost Overview Report
Navigate to the Email Panel.
The Scheduled Cost Reports window opens.
Click Add Scheduled Report and select the Cost Overview Report.
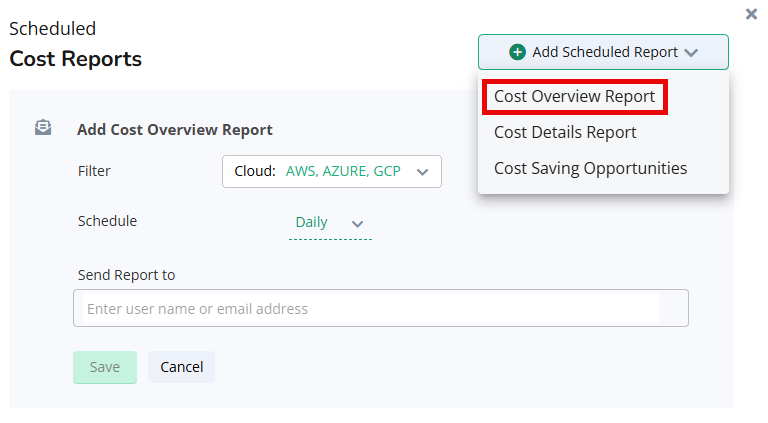
Adjust your report preferences, including providing a username or email address, selecting a scheduling frequency, like daily, weekly, or monthly, and incorporating cloud filters.
Click Save to add your report to the list in the Scheduled Cost Report window.
You can review your report and click Send Now/Edit/Delete following your action.
Add Cost Details Report
Navigate to the Email Panel.
The Scheduled Cost Reports window opens.
Click Add Scheduled Report and select the Cost Details Report.
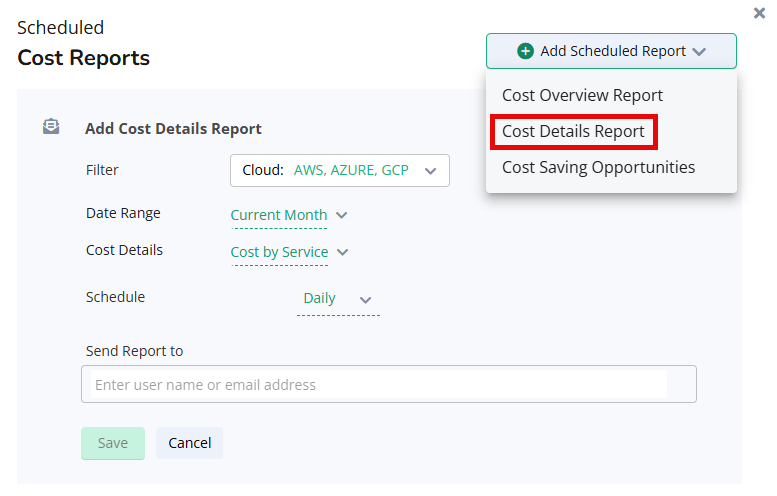
Customize your report preferences by specifying a username or email address, choosing a scheduling frequency, like daily, weekly, or monthly, defining the date range and cost details, and integrating cloud filters.
Click Save to add your report to the list in the Scheduled Cost Report window.
You can review your report and click Send Now/Edit/Delete following your action.
Note
This specification is available in all widget panels in the Cost Management Overview Dashboard.