Node Map
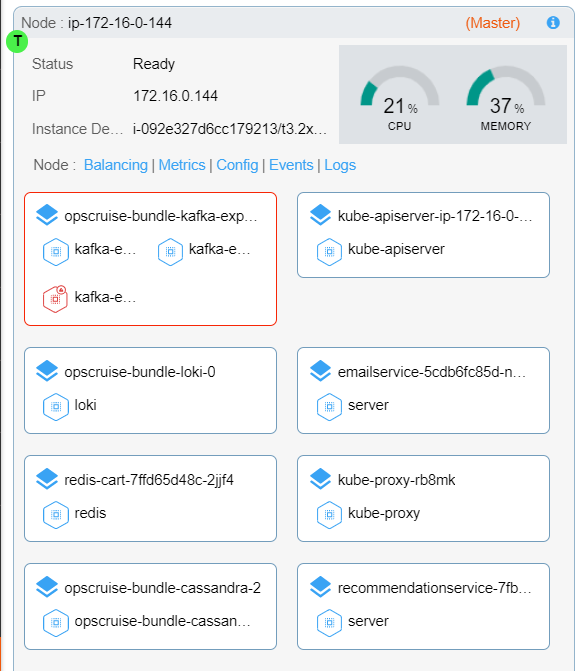
The Node Map in Container Observability enables you to view the condition of the running nodes along with services like Pods and containers of a selected node. It also indicates any anomalies detected in any container in the Node.
 |
The following table describes the details of a particular node and the available services in the node:
Filter bar | In the Filter bar, you can filter to view any specific entity. You can also filter the type of Pod labels, Containers, Nodes, and Namespace to view only the specific details of a particular entity in the Node Map. |
Node description | Provides the status of the node and the IP address of the node. Also shows the CPU and memory usage for a node. |
Clear & Save | In the right corner of the Node Map, you can click Clear to remove the filtered options, or you can click Save to save the current page settings. |
Refresh | In Node Map, you can select auto-refresh by clicking on the Refresh button, and on entering the desired time, the previously filtered items will be refreshed. |
Share | You can also click on Share to share the page details with other users. |
Badges on Node Map |
|
 | The icon represents a Pod. |
 | The icon represents a container. |