Traces
Traces provide the familiar Jaeger flame graph view of the distributed trace, showing the performance of the service and its operations being called in sequence.
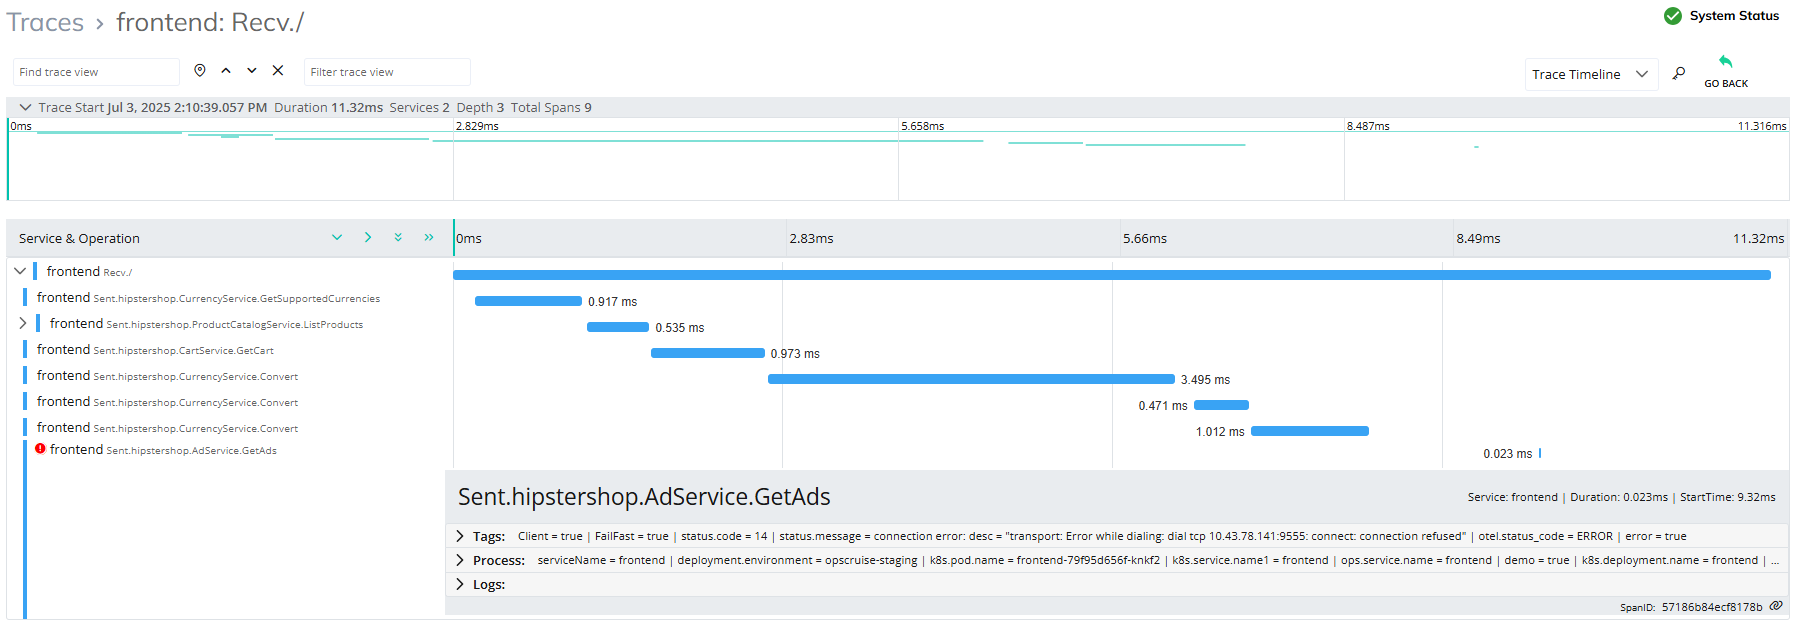
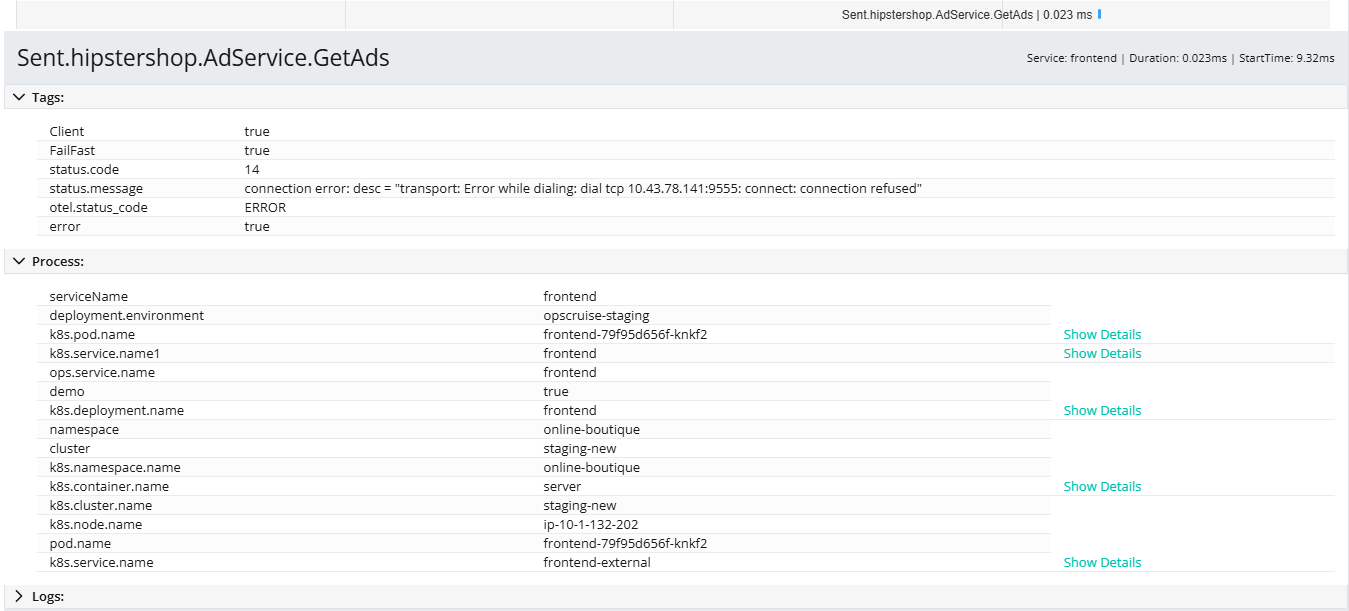
Click on service operation (span) to view more details on Tags, Process, and Logs associated with the service.
Visualize if there is high latency or any problematic error in the path or services.
Red color highlighted on a service indicates anomalies detected in a service operation.
You can visualize the slow traces caused by problematic operations and services.