Appliance Configuration
Note
The appliance configuration feature is available only to users with the IO-admin role.
The Virtana Infrastructure Observability Platform Appliance, Model 4220, also known as the Appliance, hosts IO the software stack, providing a platform for interacting with the data set collected from software and hardware probes.
The Appliance is a purpose-build hardware server that collects and correlates data from the Virtana Infrastructure Observability probes and integrations. The Appliance also contains a feature called RemoteWisdom that allows remote access to the Virtana Infrastructure Observability portal for troubleshooting, upgrades, and configuration.
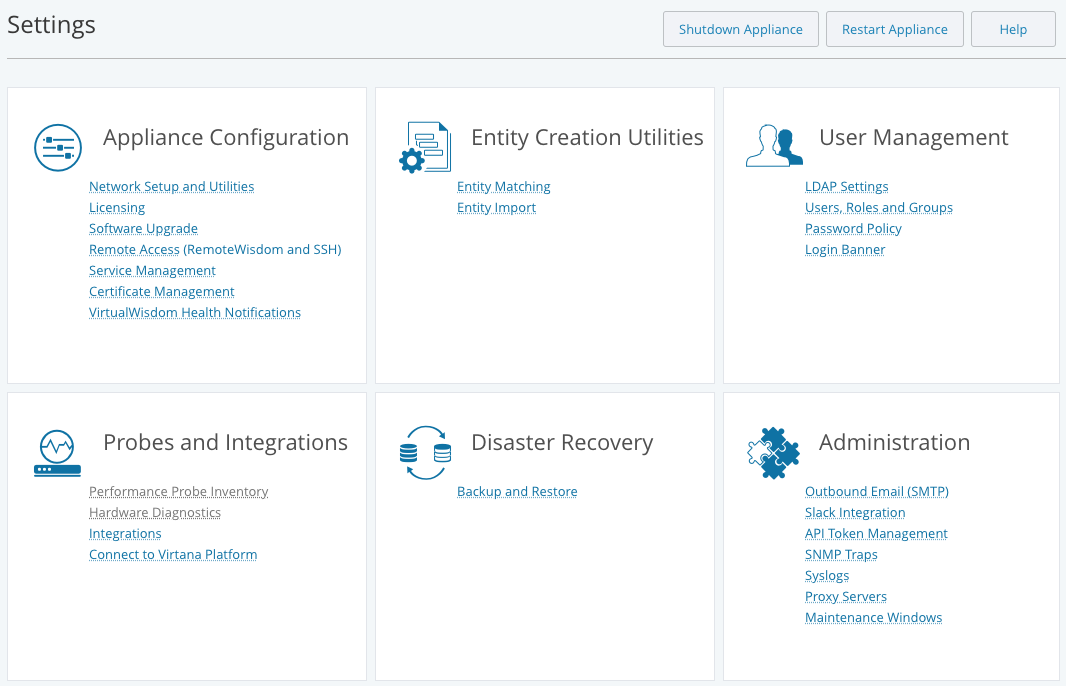
To manage the Appliance's configuration, navigate to Settings and refer to the Appliance Configuration section.
Note
Shutdown and Restart appliance are not available for Kubernetes installations.
Network Setup and Utilities
The Network Setup and Utilities features lets you configure the Virtana Infrastructure Observability network.
Select Network Setup and Utilities from the Settings screen to modify the appliance's network settings.

The Network Setup page is displayed. This manages the configuration for a single NIC. See Configure Multiple NICs for information on configuring more than one NIC.

Note
If you are deploying an OVA for the Virtana Infrastructure Observability Virtual Editions, the Network Ports section of the Network Setup screen contains information for only the NIC0 port. The MGMT port as well as NIC1, NIC2, NIC3, and NIC4 do not apply to the Virtual Editions. See the Virtana Infrastructure Observability Virtual Edition Guide for more information.
You can edit the following network settings for the appliance:
DNS address
Domain name
Hostname
Important
Be sure to use a fully-qualified domain name (FQDN) if you're using certificate based on a FQDN. Otherwise, URLs that are generated for case email alerts, etc., will give an error when clicked.
Language
NTP
Note
It is imperative that all IO data sources are synced to the same NTP sources that will be configured in IO, otherwise the platform might reject data. If syncing is not possible, then a data source’s time should be set to the same time as Infrastructure Observability IO.
Timezone
Note
As specified in the Virtana Infrastructure Observability Platform Appliance Guide, it is recommended that you set the time zone to the one in which the Appliance is deployed.
NICs 0-4, and their associated DHCP or static IP settings
Warning
If you change from static IP to DHCP connectivity as part of the network configuration of the Virtana Infrastructure Observability appliance, the DNS settings are not updated by DHCP. You must manually update the DNS settings.
Configure Multiple NICs
When you first set up your Appliance, you specify the configuration for NIC0 using the MGMT port. NIC0 is active by default and cannot be disabled. You can configure any, none, or all of the following NICs: NIC1, NIC2, NIC3, and NIC4. The example in this section configures NICs 1-4.
To configure the Appliance:
From the Settings screen, click Network Setup and Utilities.

The current settings for IO4210/4220, Network Ports, DNS and Hostname, and Time and Region are summarized on the Network Setup page.

Click the Edit button corresponding to Network Ports.

The Network Ports Configuration page displays. Click the Configure More NICs button.

The screen area is displayed below the setup for NIC0 and above the Configure More NICs button.

You can click the “x,” to the right of the Network address setup for drop down to remove the NIC configuration from the system.
The Obtain an IPv4 address automatically radio button is selected by default. Use this button to configure the Appliance using DHCP.
If you want to configure the Appliance using a static IP address, select the Set the IPv4 information manually radio button. Selection of this radio button displays the IPv4 address, IPv4 mask, and IPv4 gateway fields.

Warning
If you change from static IP to DHCP connectivity as part of the network configuration of the Virtana Infrastructure Observability appliance, the DNS settings are not updated by DHCP. You must manually update the DNS settings.
Start by configuring NIC1:
Select NIC1 from the Network address setup for drop down menu.
Enter a Description for the NIC.
In this example, the description for NIC1 is “SAN Performance Probes.”
Select the Set the IPv4 information manually radio button and enter the information for the IPv4 address, IPv4 mask and IPv4 gateway fields.
In this example, the IPv4 address is 10.10.26.9, the IPv4 mask is 255.255.255.0, and the IPv4 Gateway is 10.10.26.1.

Click the Configure More NICs button to configure another NIC. Each time that you click this button a new NIC configuration screen displays.
Repeat Step 6 for each NIC that you want to configure.
Add the routes for the NICs you added. In this example, we'll add the route for NIC1. Click the Add button next to Routes.

Enter the route information (subnet, mask, gateway, and description) and click Save.

The Info dialog displays. The appliance restarts and returns you to the Virtana Infrastructure Observability login page.
To verify the changes, return to the Network Setup page and review the configuration.
Note
If RemoteWisdom was enabled during the initial appliance set up, it was assigned to NIC0. If you choose to reassign RemoteWisdom to another NIC, follow these steps:
Select the NIC from the Select required port for RemoteWisdom drop-down menu. Only configured NICs are listed in this menu.
Optionally, you can specify a gateway for RemoteWisdom. If no Gateway is specified, the gateway of the RemoteWisdom NIC is used.
Note
Network Ports are not available for Kubernetes installations.
Virtana Infrastructure Observability, Virtual Editions
You can deploy one or more OVA(s) for the Virtana Infrastructure Observability Virtual Editions. Once deployed, you can configure NIC0.
You can configure the network settings (IP addresses, DNS servers, and NTP servers) from Virtana Infrastructure Observability, from VMware vCenter.
See the Virtana Infrastructure Observability Virtual Edition Guide for details.
Utilities
![]() |
The Utilities button allows you to manage the ping and traceroute diagnostic tools.
Using the Ping Utility
Ping functionality is specifically meant to provide feedback to the user on the connection status of NIC0, the port configured with the Initial Configuration Wizard. You can also use ping to check the connectivity of probes, DNS and NTP servers, SMI, switches, LDAP servers, backup destinations, or other data center components.
Type in the hostname or IP address that you wish to ping and click Ping.
A Success message indicates a successful ping. An Error dialog box indicates that the ping was not successful.

Using the Traceroute Utility
Traceroute allows you to verify the route (network path) of network packets. The ability to view this route makes it easier to determine where along a network path an error might have occurred.
Select the Traceroute option.
Type in the hostname or IP address that you want to trace the route for and click Traceroute.
The route that network packets travel from the Appliance to the hostname or IP address specified are listed.

Licensing
From the Settings page you can manage and import IO licenses, if you have administrator privileges.
Beginning with IO 6.2, licenses are purchased as a base license with add-on Wisdom Pack Licenses. Each Wisdom Pack incorporates an established set of IO components based on site requirements and infrastructure configuration. Licenses purchased prior to IO 6.2 must have been converted by Virtana before updating to 6.2 or later. Therefore, it is strongly recommended that you do not perform the update without the Wisdom Pack licenses ready.
Base Licenses
The Base License is the minimum license required for a IO installation. A Base License is required before installing Wisdom Pack Licenses in your environment.
A Base License can be a Subscription or Evaluation type. Enterprise (Appliance) Edition and Virtual Editions of IO can accept Subscription Base License types.
Only one Base License type can be installed on a system.
The following components are included as part of the standard IO Base License:
Core components of IO (Dashboard, Topology, Inventory, Alarms, Reports)
All IO Analytics
Splunk AppDynamics, Dynatrace, and ServiceNow Integrations
REST API SDK
Wisdom Pack Licenses
Each Wisdom Pack can be purchased as a Subscription License for the Enterprise Edition or Virtual Editions of IO. Evaluation Licenses are also available for Wisdom Packs, so you can assess the value of any Wisdom Pack for your environment.
In addition to the Base License components, each Wisdom Pack includes specific components, required for particular environments. Following are the available Wisdom Packs, which can be implemented individually or in combination, depending on your needs:
Wisdom Pack | Description | Supports1,2 | Comments |
Operating System | Each (1) license can be applied to any included OS. Each count of the license also includes 5 NetFlow endpoints. |
| Example: If you purchase 1,000 Operating System Wisdom Packs, then you also receive licenses for 5,000 NetFlow endpoints, even if you do not purchase any IP Network Wisdom Packs. |
Virtualization | Each (1) license can be applied to 1 included hypervisor or specialized OS. Each count of the license also includes 50 NetFlow endpoints. |
| Hyper-V, vSphere, and PowerVM are all licensed by host (specialized OS). |
Enterprise Storage | Each (1) license enables monitoring of 1 controller. Depending on the array type, the controller can be managing N number of engines or nodes (usually 2 or 4). The ratio in the Supports column is read as “1 license to N engines / nodes”. |
| Example: To monitor 1000 Isilon nodes and 500 SVC nodes, you need 500 counts of the Enterprise Storage Wisdom Pack, in which 250 would be consumed to monitor 1000 Isilon nodes (250 controllers) and 250 consumed to monitor 500 SVC nodes (250 controllers). |
Software-defined Storage | Each (1) license enables monitoring of 1 SDS node |
| |
SAN Switch | Each (1) license enables monitoring of 1 SAN switch port. |
| |
Wiredata | Each (1) license includes 4 Link Credits, where each count of each type of Link consumes a certain number of Link Credits. | Credits consumed per count of each link type:
| Hardware probes decrement the license count based on types of ports on the probes (current link speed). If the current speed on the link changes, the counts are automatically recalculated. Cisco STS decrements the count based on number of Cisco STS-enabled ports used. With 1 Wire Data Wisdom Pack, some examples of what you can monitor include: 16 x 4GFC Links, OR 8 x 10GE Links, OR 8 x 8GFC Links, OR 4 x 16GFC Links, OR 16 Cisco STS Links |
FC32 Wiredata | Each (1) license includes 4 Link Credits. | 1 credit consumed per link. | Hardware probes decrement the license count based on types of ports on the probes (current link speed). If the current speed on the link changes, the counts are automatically recalculated. One (1) FC32 Wiredata Wisdom Pack can monitor 4 x 32GFC Links Note: FC32 Wiredata Wisdom Pack licenses are currently not compatible with line speed rates other than 32G |
IP Networks | Each (1) license enables monitoring of 1 NetFlow endpoint. | NetFlow Integration (1 endpoint) |
1 - A single quantity of a Wisdom Pack that includes multiple integration types cannot be allocated to multiple IO servers. For example, if you have a Virtualization Wisdom Pack, you cannot allocate a Hyper-V integration on server A and allocate the NetFlow Integration on server B.
2 - Additional supported items can be added between releases. Check with Virtana for the latest support information.
3 - Each unique monitored IP address consumes 1 count of NetFlow license, whether it is the source or destination IP at the time it was first discovered. Multicast/broadcast IP addresses do not consume NetFlow licenses.
Licensing information for the following Integrations can be found in their respective User Guides:
InfiniBox
Kubernetes
KVM
Linux
NetApp
Nexus
PowerStore
Pure
Solaris
UCS
Unity
VSP
Windows
XtremIO
Evaluation Licenses
Wisdom Pack evaluation licenses are available for IO integrations. These licenses allow you to easily try out any integrations in your environment.
Wisdom Pack evaluation licenses are separate from, and do not affect, paid IO subscription licenses. However, each evaluation license does add a fixed number of integration licenses to the licenses already on the appliance.
Evaluation licenses expire at a fixed date after generation of the license (not installation date). Different evaluation licenses can have different expiration dates. When an evaluation license expires, all licenses it added to the license pool are removed. Once expired, the license cannot be added to any IO platform.
You can upload multiple Wisdom Pack evaluation licenses to an appliance, but each evaluation license can be installed only once on a particular IO instance.
The type and number of evaluation licenses can be viewed on the Licensing page, accessed from the Settings tab. The Licensing table also displays the date the license was applied, the expiration date (after license generation), and the number of days remaining before the license expires.

Evaluation licenses can be applied to IO 6.7.1 or later. The licenses will continue to work after IO upgrades.
Contact your account team or Virtana Support to request an evaluation license.
License Types
The Base License and Wisdom Pack Licenses are installed as a Subscription or Evaluation License types.
Subscription Base
Expires at end of paid subscription term
Full access (as long as the license is not expired)
Use with Subscription Wisdom Packs and Evaluation Wisdom Packs
Evaluation Base
Expires upon end of agreed evaluation period (typically 30 or 60 days)
Full access, with some limits
Use with Evaluation Wisdom Packs
A single IO Server can only accept one (1) type of Base License. The base license type determines which wisdom pack license types can be used.
Uploading a License
All license types are installed the same way.
You cannot use a Subscription License on an OVA with an Evaluation License. You must deploy a new OVA and upload a new license.
Prerequisites
You must have downloaded the proper license file to a system that is available to IO.
You must have administrator privileges on IO.
From the Settings tab, click Licensing.
The Licensing page displays information about the IO Base License and all of the WisdomPack licenses installed.
Licenses are contained in a single file that can be replaced with new values. Values can be replaced, but not added, to a license file.
Click Upload License.

Use the Browse button to select the license file and click Upload.
A dialog box displays, warning you that the upload deletes previous licensing information.
Click OK.
The new license file is uploaded and a message informs you that the license file was successfully loaded.
The new license displays on the Licensing page.
Tip
You can view license usage details by accessing License Reports.
License Notifications
Licensing notifications display in the IO UI, such as warnings that a license is about to expire. The content of the Licensing dialog box is different, depending on whether you are logged in as a IO administrator (with the IO-admin role assigned) or a user that is not assigned administrator privileges.
Non-administrators do not have access to configuration settings in IO and so cannot upload or modify licenses.
Note
If you restore a backup on an appliance with no license, no health notifications are generated to notify you that the license is not there. Always ensure the appliance is licensed after restoring from a backup.
Note
Oversubscription health notifications are not generated for software integrations after a Virtana Infrastructure Observability 6.1 restore. Restoring a IO 6.1 backup overwrites the licenses.
Expiring Licenses
You can view the expiration date of any WisdomPack License, Base License, or Evaluation License from the Licensing page on the Settings tab.

Within thirty days of a Base or Wisdom Pack license expiring, IO alerts the user in the following ways:
Displays a dialog in the UI with a warning that licenses are about to expire
Displays the expiring licenses in red font on the Licensing page
When a Base or Wisdom Pack license expires and results in oversubscription, IO alerts the user and Virtana in the following ways:
Displays a message in the UI with a warning that licenses have expired
Displays the expiring licenses in red font on the Licensing page
Sends an email alert to all IO administrators
Evaluation licenses expire based on the requested length of time assigned to the license, starting from the day the license is generated (not installed). When the license is about to expire, a notification is sent. When the license expires, all license counts associated with the Evaluation license are removed from the appliance.
From the Licensing page and from the Integrations page you can access a License Report that shows license usage information, based on license type, such as Enterprise Storage Wisdom Pack, FC32 Wiredata Wisdom Pack, etc. For each license type, the report displays the total number of licenses, as well as the number of used and remaining licenses.
Following is a sample License Report page.

Auditing License Consumption Over Time
You can download a licensing audit log by clicking on the hamburger menu and then Download Audit Log, as shown in the following image.

After clicking on the button, a zipped Excel spreadsheet will be downloaded to your system. The spreadsheet contains two tabs. The first is a running log of Applied Licenses, which contains the following information:
Log Timestamp (ms) (milliseconds since Epoch)
Log Timestamp (UCT) (human readable)
UUID
Wisdom Pack
License Type
Expiration Date (UTC)
License Count
The second tab is a running log of Consumed Licenses. It contains the following information:
Log Timestamp (ms) (milliseconds since Epoch)
Log Timestamp (UTC) (human readable)
UUID
Wisdom Pack
Integration
Cost
Count
Used
The licensing audit logs are updated every 24 hours.
Software Upgrade
Use the IO Software Upgrade task on the Settings tab to upload an update of IO to the Appliance or Virtual Edition.
About This Task
If provided an experimental bundle by technical support.
Prerequisites
You must have downloaded the update bundle to a place from which your web browser can access it.
You must have administrator privileges on IO.
All users, other than the administrator performing the upgrade, must be logged out of IO
Steps
From the Settings tab, click Software Upgrade.
The Software Upgrade page displays.
Use the Browse button to select the update file.
Important
To complete the next three steps, there must be sufficient space on the Appliance or Virtual Edition. If there isn't enough space, you will see a message similar to what is shown below.

Click Upload to upload the selected file.
The Software Upgrade page displays file upload and validation progress. If validation is successful, the update is ready to apply.
If installing a bundle provided by technical support outside of the normal release cycle, it might not be signed for general distribution. These bundles display a warning notice that you are uploading an experimental bundle. See "Installing an Experimental Bundle" if you see that warning.
Note
Uploading an update of Virtana Infrastructure Observability does not actually update the Appliance, rather it uploads an update of Virtana Infrastructure Observability to a staging area in the Appliance.
To apply the IO update, click the Update button.
When you click Update, the Info dialog box is displayed.
If you decide not to apply the bundle, click Remove File to clear the staged bundle.
Click OK to confirm the update.
If the update requires an appliance reboot, a status box displays instructing you to wait for IO to come up and stating that you will be redirected to the IO login page when the process completes.
IO update reboots your system without warning when the progress reaches 100%. If the page does not automatically update after 10 minutes, manually refresh the browser.
Note
Software Upgrade is not available for Kubernetes installations.
Installing an Experimental Bundle
Typically, IO update bundles are certified for general distribution to all customers, and are digitally signed for that purpose. Occasionally, technical support might provide, and work with you to install, an experimental update bundle intended to address a specific issue that you are experiencing.
Experimental bundles are not available for general distribution and, when uploaded to the appliance, generate a warning that you are uploading an experimental bundle.
If you see this warning unexpectedly, remove the update from the appliance and contact technical support.
Certificate Management
The Certificate Management task allows you to generate a security certificate for use with Virtana Infrastructure Observability it uploads an update of. You can bypass the trusted security certificate warning by generating your own security certificate request and using that request to get a certificate signed by a certificate authority such as Verisign.
It is recommended that you generate your own security certificate and have it signed by the certificate authority of your choice.
Follow these steps to generate a security certificate for Virtana Infrastructure Observability.:
After Selecting a Signed Certificate Type from combo-box following 2 options would be displayed
A) "Generate Self Signed Certificate" and
B) "Upload Signed Certificate"
by default "Upload Signed Certificate" option is selected.
Steps for "Generate Self Signed Certificate"
From the Settings screen, click Certificate Management.
The Certificate Management screen is displayed.
Click Generate CSR to generate a certificate signing request.
The Generate CSR dialog box displays.
Enter the following information in the Generate CSR dialog box:
Table 227. Generate CSR Dialog ParametersParameter
Definition
Country
Two-letter ISO code for the country in which you are located. Required.
State
Province, region, county, or state in which you are located (no abbreviations). Required.
City
Name of the city in which you are located (no abbreviations). Required.
Company
Name of your company. Required.
Department
Name of your department or organizational unit. Required.
Server FQDN
Fully-qualified domain name for your organization. Required.
Email
Email address of the contact at your company, generally an administrator or the IT department.
Important
You must use a FQDN for Hostname in Appliance Network Settings.
Warning
Do not use backslash (\) or double quote (") character in the Certificate Management Request.
Click OK.
The Generate CSR dialog box disappears and you see a message is displayed indicating CSR generation as well as the date and time of the CSR’s generation.
Click the CSR to get the option to view or download the CSR.
Deliver the generated CSR to your certificate authority using your normal process.
After you get your certificate back from the certificate authority, follow these steps:
Complete the SSL Certificate by clicking Browse to find your SSL certificate. Concatenate the root certificate, all intermediate certificates, and the signed certificate into one file.
Click Upload to upload the certificate.
You are logged out of your UI session. In approximately one minute you are directed to the Virtana Infrastructure Observability Login screen.
Steps for Upload Signed Certificate
Browse/Upload the certificate file and private key file for your IO appliance (e.g., the cert.pem file and key.rsa file).
Enter the passphrase as per your IO application certificate-protected password. If you send a blank passphrase value, then the back-end service will consider the IO application UUID for validating the certificate.
Click “Save”
The confirmation dialog box displays then Click “Yes”.
The certificate gets applied to your appliance and appliance get restarted.
Case & Health Notification Management
Users can set the Number of days for Closing / archival for the Open Cases from an option in the Settings, under Appliance Configuration as below

Administrators can define after what period of time to close and archive cases, and when to delete (purge) them from the appliance.
There is the ability to set different schedules for Metric Rule and Health Notification Cases.
By default all the checkboxes are checked with below default values

If Administrator disables both the Checkboxes and tries to enable them again, then the default duration is set to "1825" number of days depicting 5 years. One can again set the desired number of days value manually.


Slack Service Configuration for command Interface
Creating a Slack Application
This guide outlines the step-by-step process to create a Slack app, including obtaining the necessary tokens and configuring the app YAML file.
Access the Slack App API Link: Navigate to the Slack app API link: https://api.slack.com/apps?new_app=1.
Create a New App:
Click on "Create New App" to initiate the creation of a new app from scratch.
Provide a name for the app (e.g., "VP Test App").
Choose the desired workspace where the app will be installed.

Generate App Configuration Tokens
Locate the "Generate Token and Scope" option.
Click on it to generate the tokens.
Obtain the following tokens:
App Token (e.g. xapp-1-00000000000-0000000000000-0000000000000-0000000000000).
Signing Secret (e.g., 00000000000000000000000000000000).
Note
Both the secret key and the app token are essential for configuring the Slack app YAML file.

Set Up Slash Commands
Navigate to "Socket Mode" from the left menu and enable socket mode.

Proceed to "Slash Commands" from the left menu.

Click on “Create New Command”.
Provide a command name and description only (e.g. /io-cli).
Note
Slash commands are necessary for configuring the Slack app YAML file.
Add Scope
Navigate to OAuth & Permissions, and go to Scopes.
Click Add an OAuth Scope to add bot token scope and user token scope variable - files: read and files: write.


Install the App
Access "Installed App Settings".
Install the app in your workspace.
Obtain the bot user OAuth token. Example: Bot User OAuth Token: xoxb-0000000000-0000000000000-0000000000000-0000000000000
Note
Bot tokens are required for configuring the Slack app YAML file.
Obtain the User OAuth token. Example: xoxp-0000000000-000000000000-0000000000000-00000000000000000000000000000000
Service Configuration
Obtain and Modify Configuration File.
Download the sample configuration file from IO Appliance settings: Settings > Slack Integration > Download Configuration File.
Customize the configuration file to align with your Slack app and IO credentials.

Adjust Configuration Parameters
Replace placeholders in the configuration file with actual values:
cmdName: Slash command for your app.
appToken: App Token obtained from Slack.
botToken: Bot OAuth Token retrieved from Slack.
signingSecret: Utilize the generated secret key for your app.
set enableSocketMode: true ,as your app creates a secret key.
userAuthToken: User OAuth Token retrieved from Slack.
slackFileSizeCleanupLimit: This attribute is optional, and if not specified, it will default to 1000 MB. When the limit is reached, we will automatically clean up the files.
DataSource: For data sources, please supply your IO application details, IP address, and access token. To generate an access token, utilize the IO application through UI. Navigate to Settings>API Token Management.
Step 3: Upload and Save Configuration
Navigate to the IO Appliance UI.
Browse and upload the modified configuration file.
Save the uploaded configuration using the save button.

Step 4: Store Configuration Files
The configuration files will be stored in the IO appliance directory: /data/configuration/integration-slack-app-config.yml.
The Slack App integration service will automatically recognize and utilize the uploaded configuration file.The service will utilize the Slack app token and data source information specified in the configuration file for seamless integration.
List of all supported commands
Help Command: This will return all supported commands.
Note
/io-cli should be replaced with your Slack app command name.
Command: /io-cli help
Command: /vp-cli get-info
Description: Shows data source configuration details.
Command: /io-cli get-entity-types
Description: Shows list of entity-types
Usage: Get-entity-types --filter ‘Header=value’
Command: /io-cli get-entities
Description: Shows entities by given entity type
Usage: Get- entities <entity type> --page <p> --limit <n> --props <'p1,p2,…pn’> --filter ‘header=value’
<entity type>: This should be the entity type (e.g. ESXHost).
props <'p1, p2, ... pn'>: This refers to the properties of the entity type that will be displayed in the results. For example, it could show information such as the number of VMs it has.
Command: io-cli get-metric-names
Description: Shows metrics by given entity type
Usage: Get-metric-names <entity type> --filter ‘Header=value’
<entity type>: This should be the entity type (e.g. ESXHost).
Command: //io-cli get-cases
Description: Shows cases of the application by period
Usage: get-cases --period <5d/1m/2hr/10min> --page <p> --limit <n>
Command : /io-cli-cmd get-cases-by-ids
Description : Shows alarm cases by IDs.
Usage: get-cases-by-ids caseId1,caseId2,..n
CaseId: Argument should be the case id.
Command: /io-cli-cmd show-trend
Description: Shows metric trend for the specified entity.
Usage: show-trend <entity id> <metric name> --period <5d/1m/2hr/10min>
<entity id>: This should be the entity id (e.g: 32c71dce0376470c8b742c1e99e6e47c)
<metric name>: This should be Metric name (e.g Server_cpu_usage).
Command: /io-cli get-related-entities
Description: Shows related entities of the application by entity type.
Usage: Get-related-entities <entity type> --name <name> --relatedEntityType <relatedEntity> --filter ‘Header=value’
<entity type> : This refers to the type of entity for which results are desired. For instance, it could be "ESXHost."
<name> : This represents the specific entity name within the given entity type (e.g., ESXHost).
<relatedEntityType>: This refers another entity type for which related values are sought. For example, in the case of ESXHost, we might seek related values such as VirtualMachine.
Command: /io-cli get-entities-topn
Description: Shows the top n entities by metrics.
Usage: Get-entities-topn <entity typ> <metric name> --top <n> --peiod< 5d/1m/2hr/10min> --filter ‘Header=value’
--top <n>: The limit parameter accepts a numerical value (--top 10).
<entity type>: This should be the entity type (e.g ESXHost).
<metric name>: This should be Metric name (e.g Server_cpu_usage).
Common Option
Table 228. OptionsOption
Description
--type
Specify the entity type to retrieve entities.
--page
The page parameter accepts a numerical value (--page 0), indicating the starting page for the entity pagination list.
--limit
The limit parameter accepts a numerical value (--limit 10), determining the total number of records to include in the entity pagination list.
--period
This period can be <5d/1m/2hr/10min>. This duration can be expressed in formats such as days/months/hours, or minutes.
--filter
Utilize this option to refine results by specifying a filter header name and a corresponding value (--filter 'Header=value').
